
I am looking at USDCAD at the moment. It just formed a basic bullish 5-0 harmonic pattern. Let’s see if it starts to bounce from here, and a breakdown of current level might potentially lead us to around 1.0025 level. Here is the CHART!
Trading Journal
Something about $AUDJPY 20102010
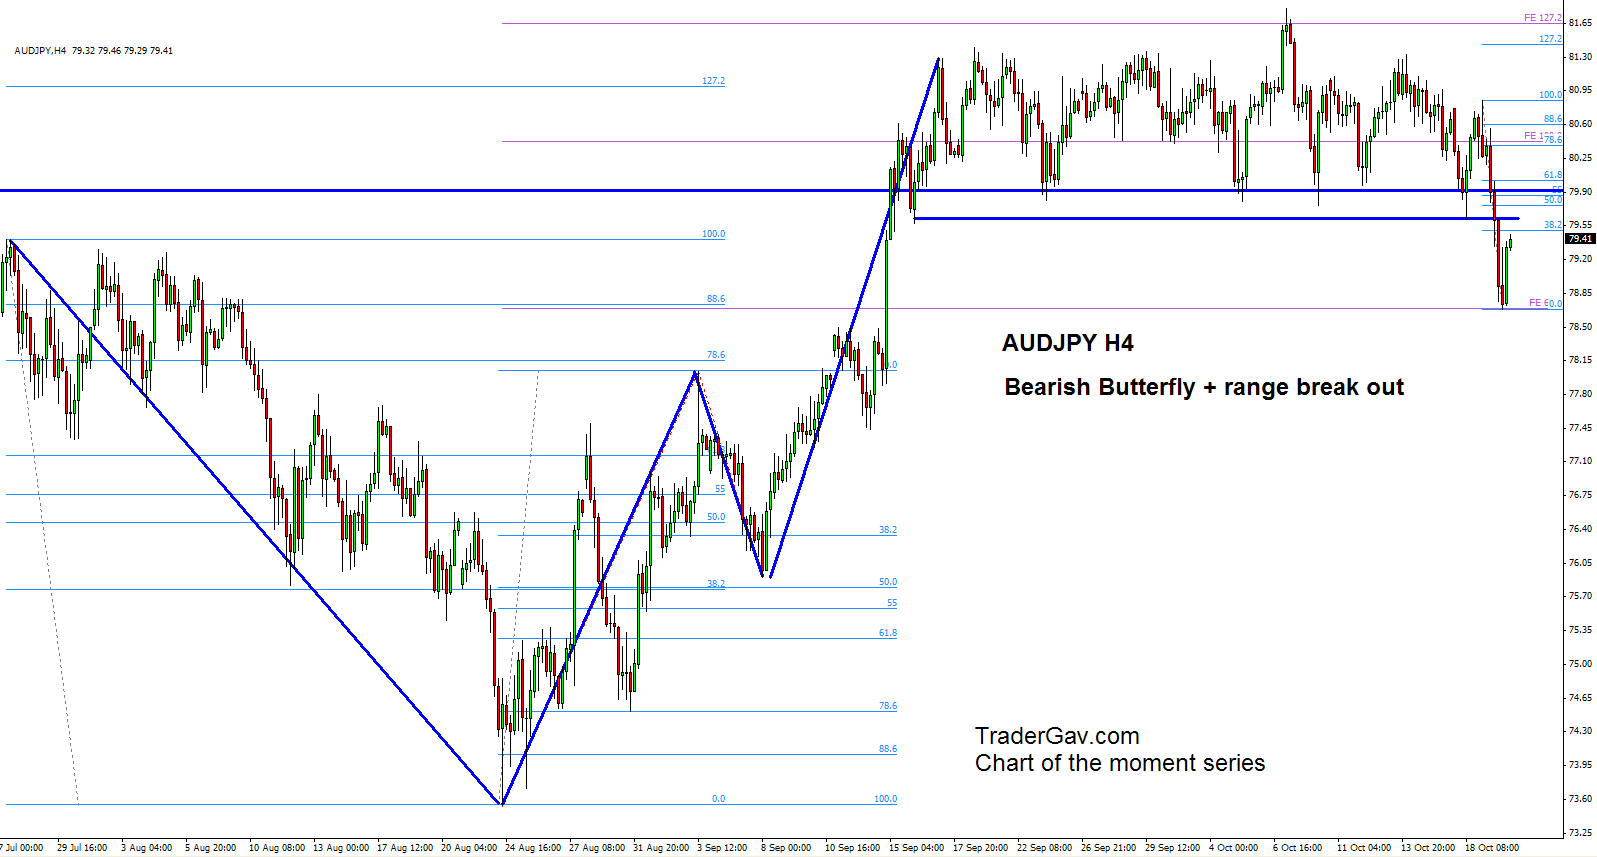
I was watching AUDJPY. I thought it was going to invalidate the Bearish Butterfly formation. We had just broken out from the trading range yesterday, and now it renews my interest in shorting the pair. I am watching closely and preparing to build a swing short position. what do you see here? Here is the…CHART!
Another look of $EURGBP, the big picture 17 Oct 2010
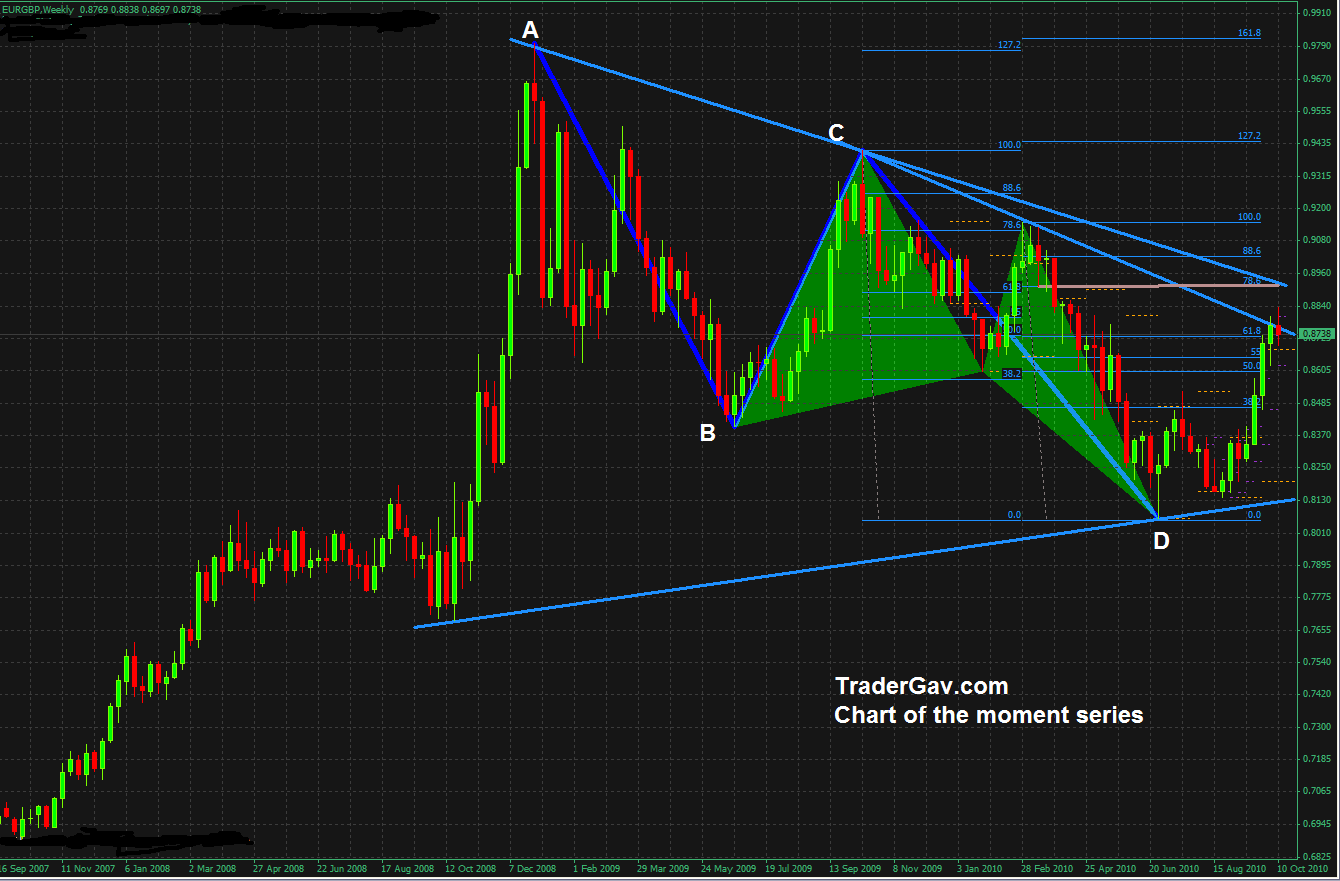
Let’s have a look at the weekly chart of $EURGBP. We have a pennant forming, with ABCD and Bullish Butterfly formations within. It is just so beautiful. I see two possibilities here. First, we might start to have correction right now with 88 level as immediate resistance. Second, we might have another leg and approach […]
ABCD..$EURGBP 13 Oct 2010

Just in case you are into this, there is an ABCD formation in hourly chart of EURGBP. I looking at 0.88 level to be broken for any further downside possibility. Here is the Chart!
Is it time now? $USDCAD 12 Oct 2010

I mentioned in twitter yesterday, I was considering building a small long position of USDCAD. I thought it will be easier to share a chart here. We have completed a Bearish butterfly, and ABCD formation. Of course, there are other factors to be considered, from technical point of view, I am interested in keeping my […]
Is it time now? $USDJPY 04 Oct 2010

Here is the 240-min chart of USDJPY that I am looking at. Do you see the pattern here? Here is the chart.

