
Just a quick note and chart about $AUDUSD. For short term trading, potentially, I am interested in going short if the level around 1.0685/1.0670 is broken. Let’s see how it goes. Here is the …..CHART!!
Chart of the moment
$GBPUSD 03 February 2012

Here is the cable chart to update my last post. $GBPUSD forced through the resistance level, pulled back, and headed higher. It reacted at the problematic level, and the next Long target will be around 1.6040 if it decided to go further. Let’s see how it goes. Here is the …. CHART!
$GBPUSD 25 January 2012

Here is the chart of cable with the levels I am watching. For the time being, I am looking at potential short near the level.
$USDCHF 29 Nov 2010
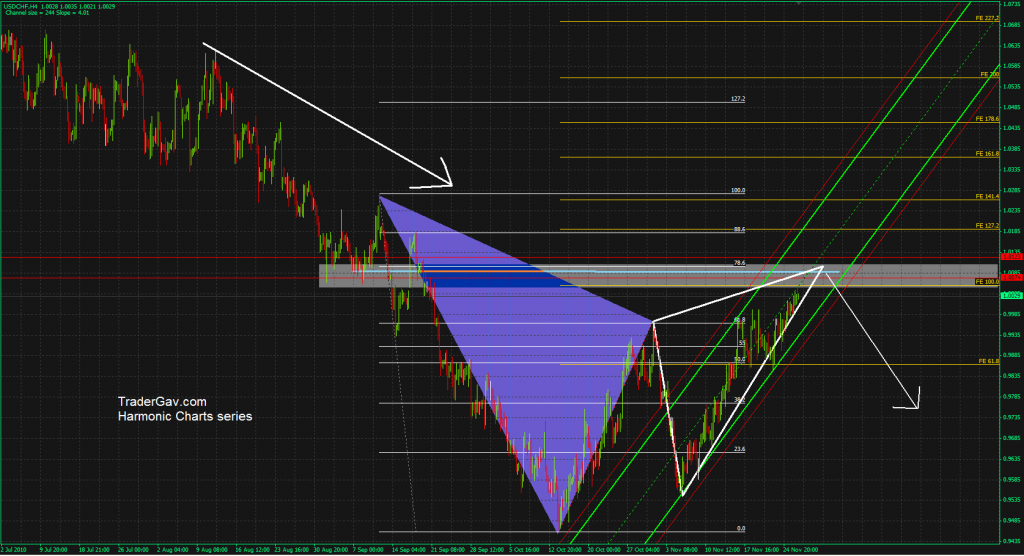
Here is the USDCHF. From technical point of view, it is forming a almost perfect harmonic pattern. Every point hits the target. Well, this doesn’t mean the pattern will work out. However, pattern recognition trading is about providing you a road map, or a window for you (well, at least, for me) to enter the […]
$USDJPY 10 Nov 2010

Here is the USDJPY chart. I am looking at 83 area for potential short trade. There are confluences of Fib extensions, harmonic patterns formation, and price resistance area. Here is the chart to confuse you.
$GLD GOLD 08 Nov 2010
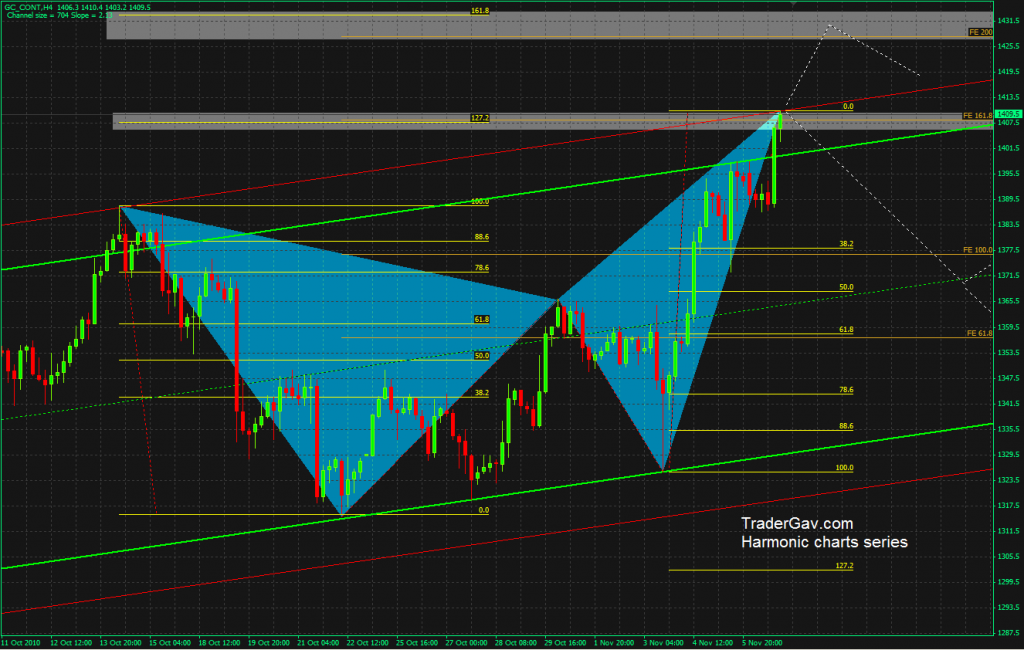
I am looking at GOLD chart this morning, I got the feeling it might be the time to see some corrections soon. It is now trading around the top of the recent channel, and there are confluences of Fib extensions and harmonic patterns. I have two potential zones defined on my chart. Let’s see how […]

