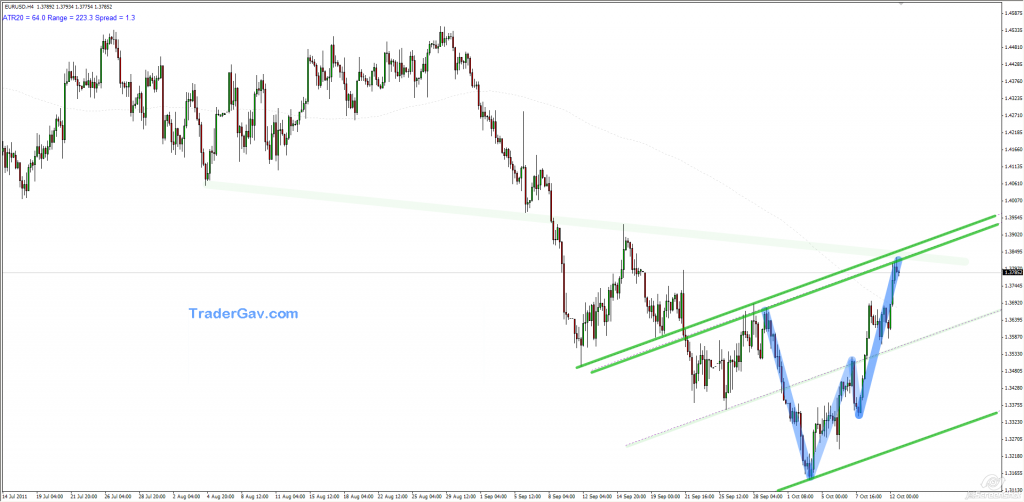
I have been stalking a short of EURUSD. (Well, who doesn’t?). However, I prefer to see price pushing a little further before establishing short. Let’s see. As the chart shows, we have confluence of channel, hamornic pattern. And if you notice, it is retesting the previous trend lines. OK, here is the….. CHART!!!!
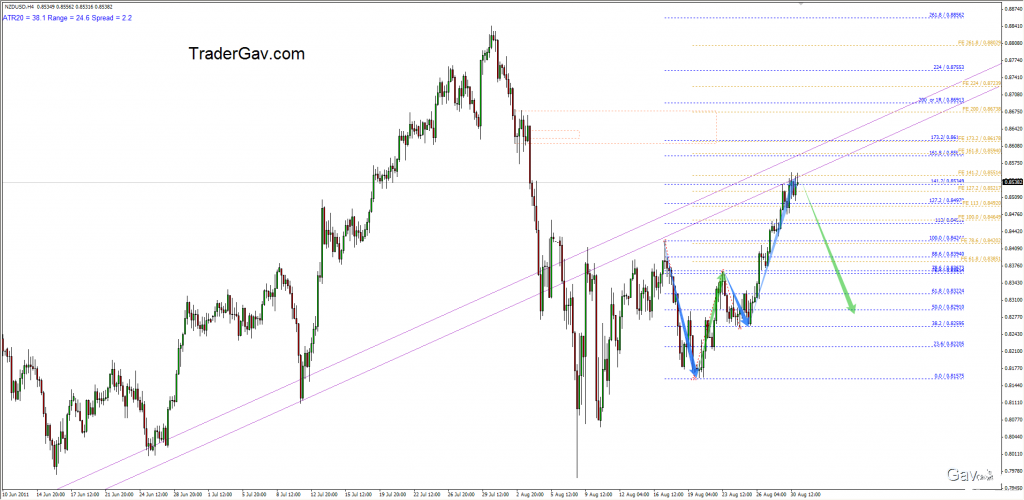
Bearish Butterfly
$NZDUSD 31 August 2011
A bearish harmonic setup is observed while NZDUSD is retesting the broken trend line. Bias remains short for now.
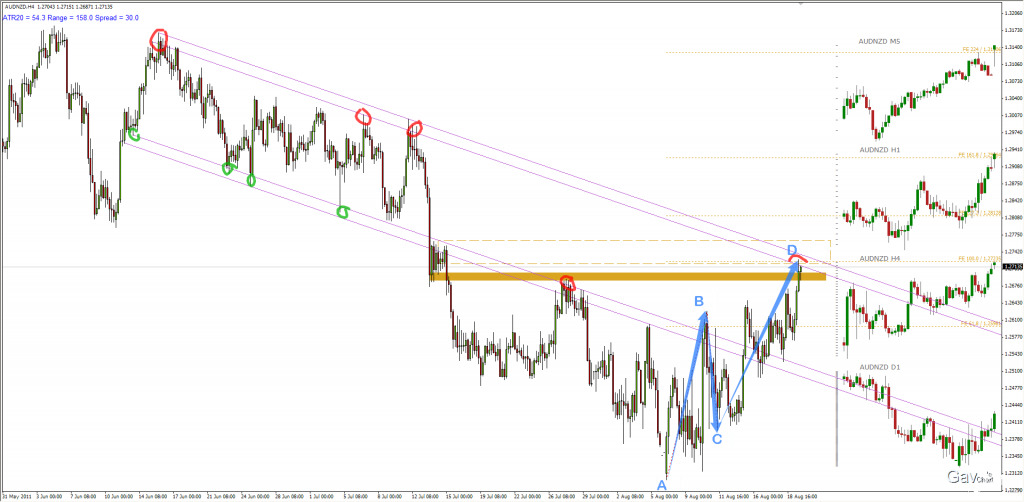
$AUDNZD 19 August 2011
Here is another potential swing trade setup I have been looking at. $AUDNZD is testing the established down trend line, and with completion of bearish ABCD formation. I expect price to face resistance at this level. I’ll be watching price action closely next week to confirm my thought. Here is the….CHART!
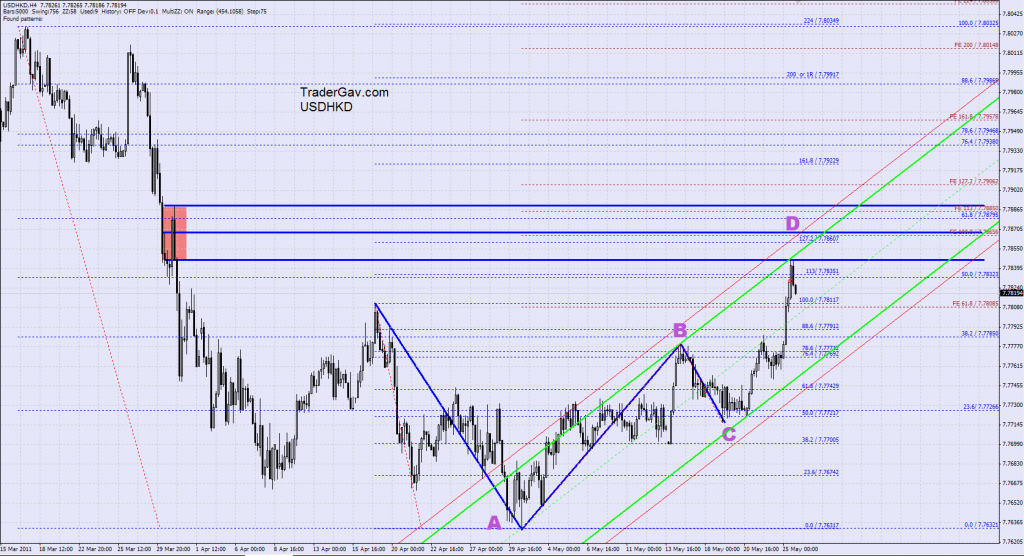
$USDHKD 26 May 2011
Her is another simple technical setup. I thought this is a beautiful chart. Unintentionally, I have turned this blog into a chart library. Well, not a bad idea. Anyway, watching this symmetrical movement into resistance zone. At the time of posting, the pair starts moving down during early Asian session…let’s see how it goes. Here […]
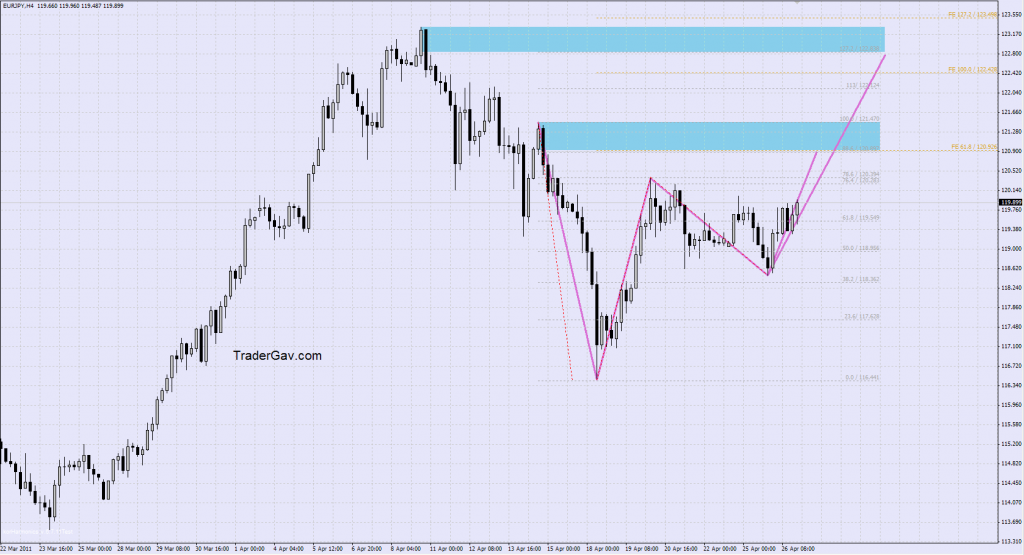
$EURJPY 27 April 2011
So, long weekend is over, and I am back to my trading desk. EURJPY caught my eyes, and potentially, I am looking at short setup in the area near 121, and next will be looking at 123. Here is the …. CHART!
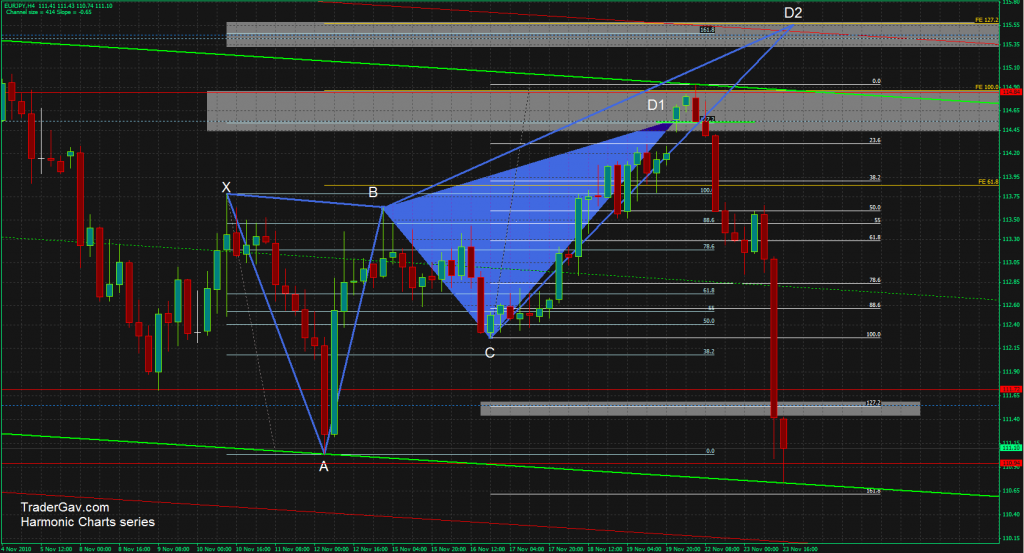
$EURJPY 22 Nov 2010
We have a gap up during Monday Asian morning. I have two levels in my radar for potential short position. It is the confluence of resistance level, Fib extensions and channel median line. [tab: Setup] Here is the CHART to confuse you. [tab: Update 24 Nov 2010] This type of ‘fast-and-furious’ sell off does not […]