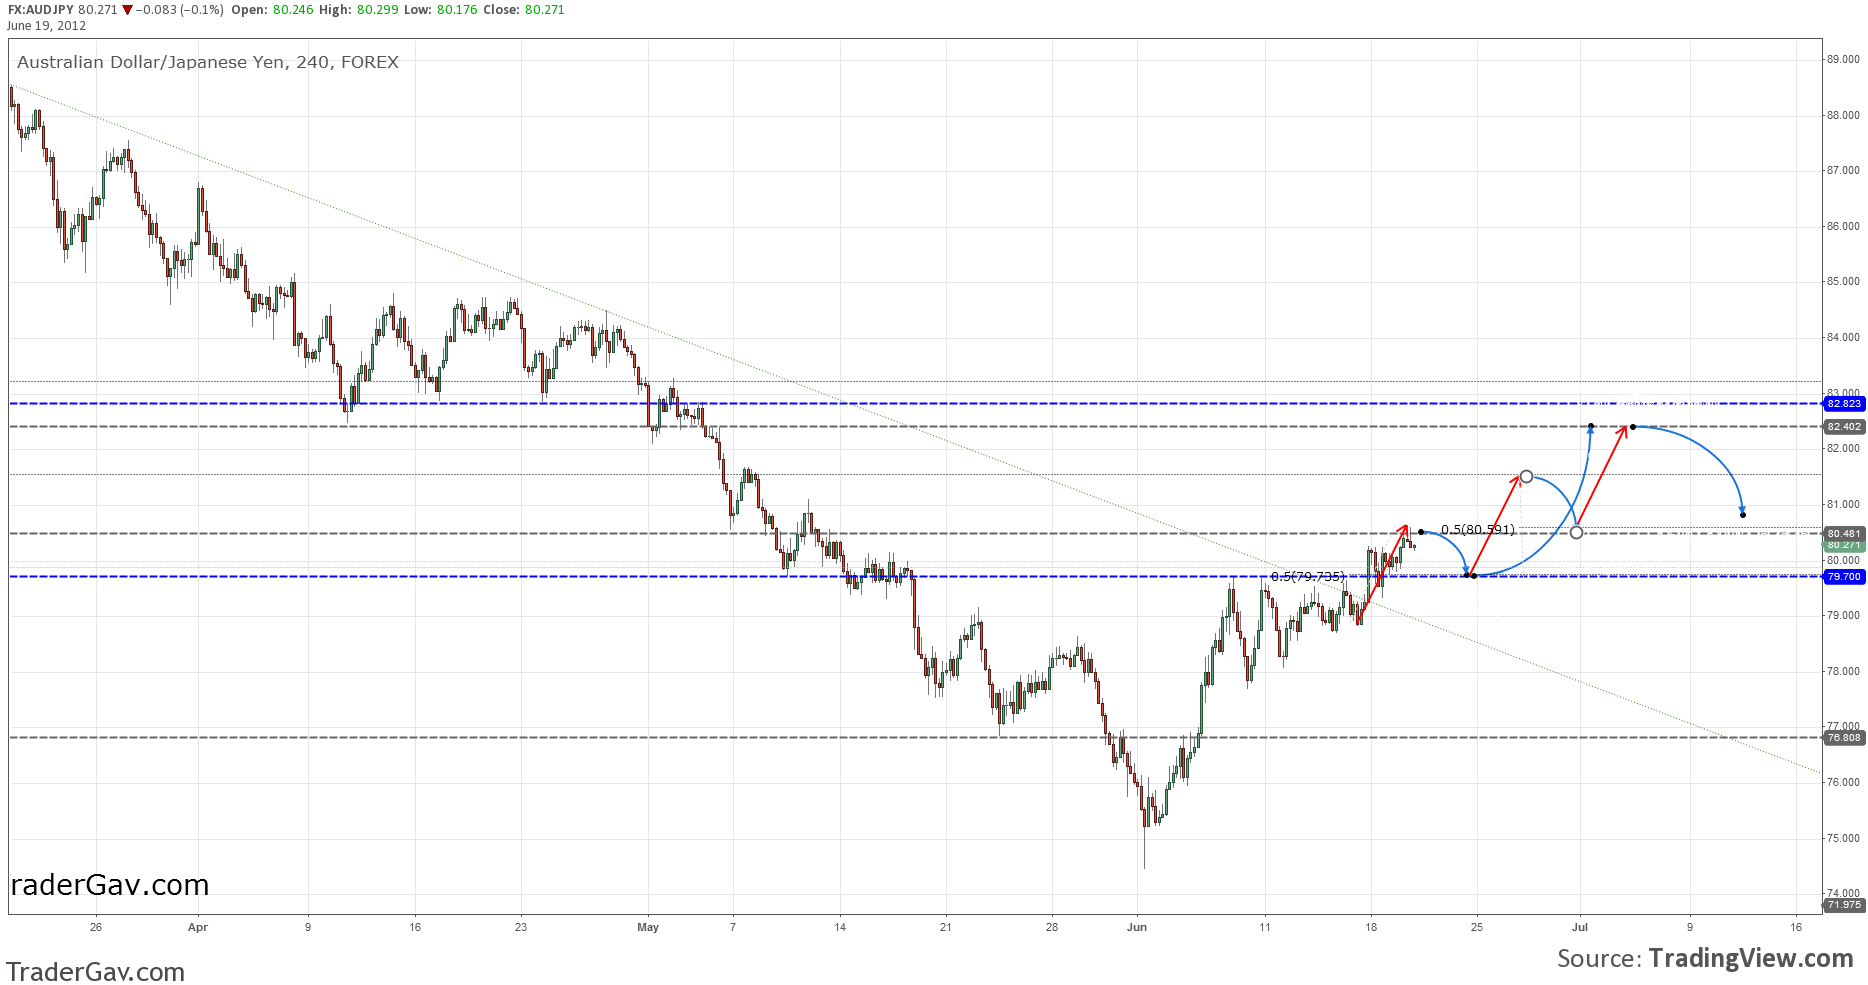
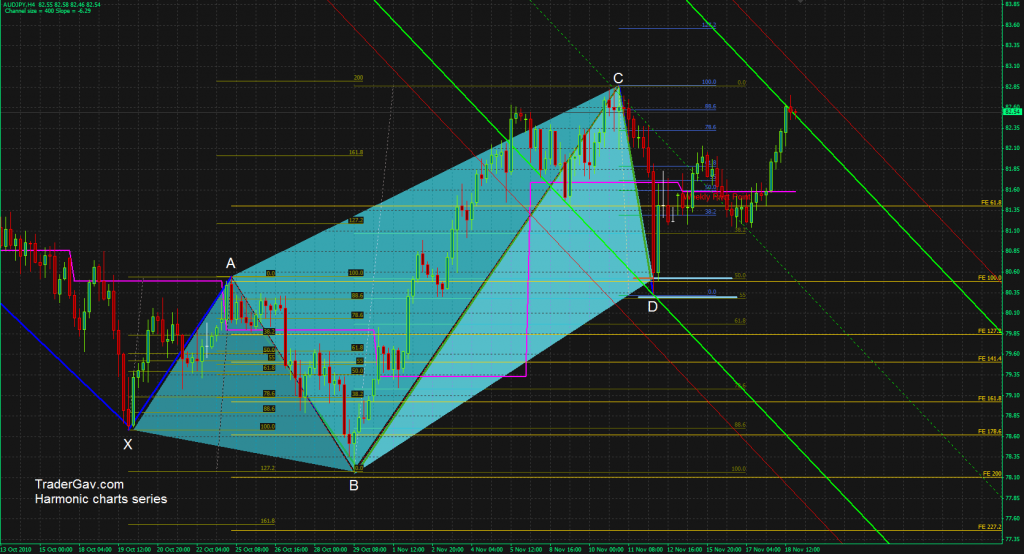
Here is the potential symmetrical movement I am watching while AUDJPY approaching 82.50/80 resistance zone. �Of course, market is never perfect, let’s see how this plan works out.
by Gav 3 Comments
I have stopped posting my trade long time ago for various reasons. Anyway, I thought I might throw in an example today to show how I trade gap. In fact, I am not really sure if �I can call this a gap fill strategy, as it is basically a simple support/resistance trade. After all, everything comes back to your level. Define your level, and plan a trade around that. That’s what I am doing.
Here is 5-minute chart of AUDJPY. �There were quite a number of FX pairs with Sunday gaps this week, I picked this pair as it was showing me the cleanest setup at the time I was back to my workstation. I waited for the pair to retest the 5-min level, and put the target at the gap opening , the end result gave me slightly more than 2R.

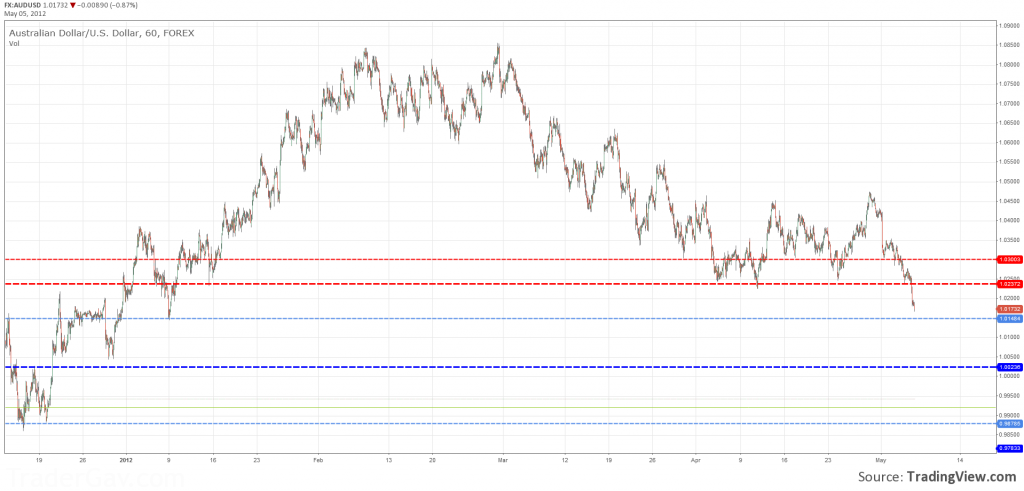
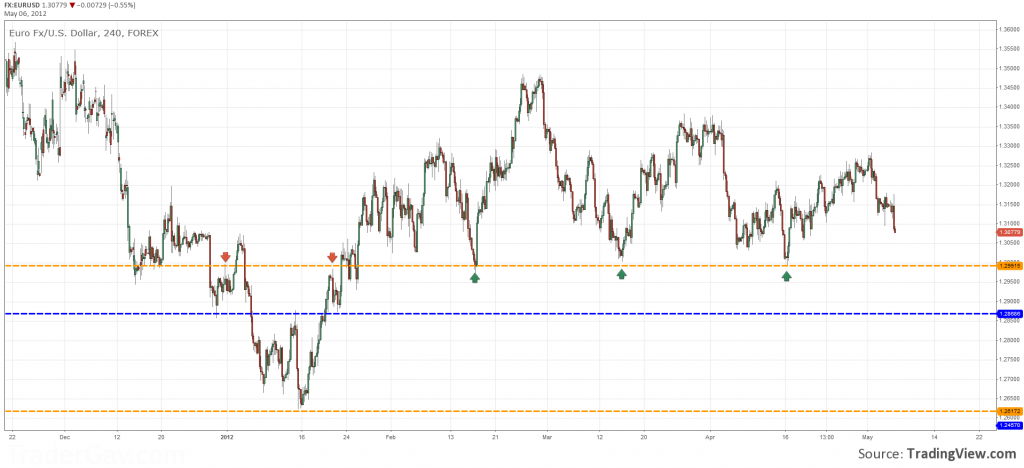
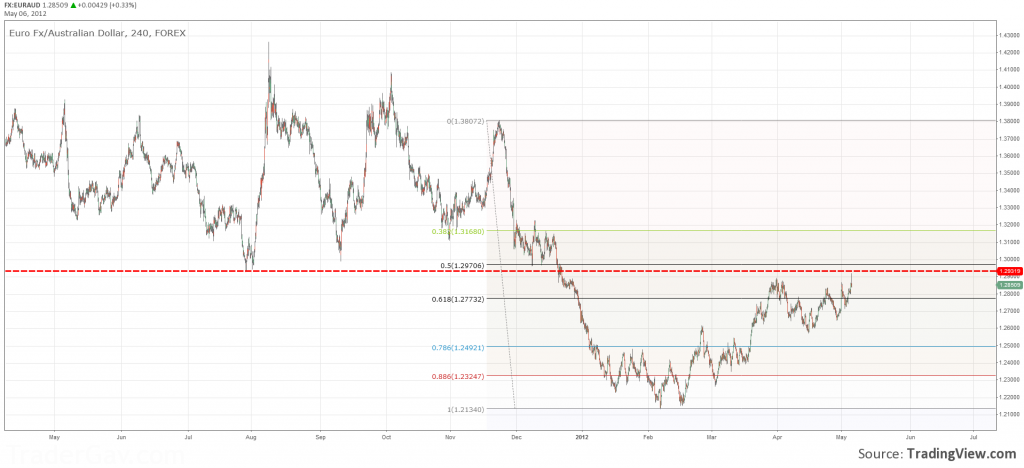
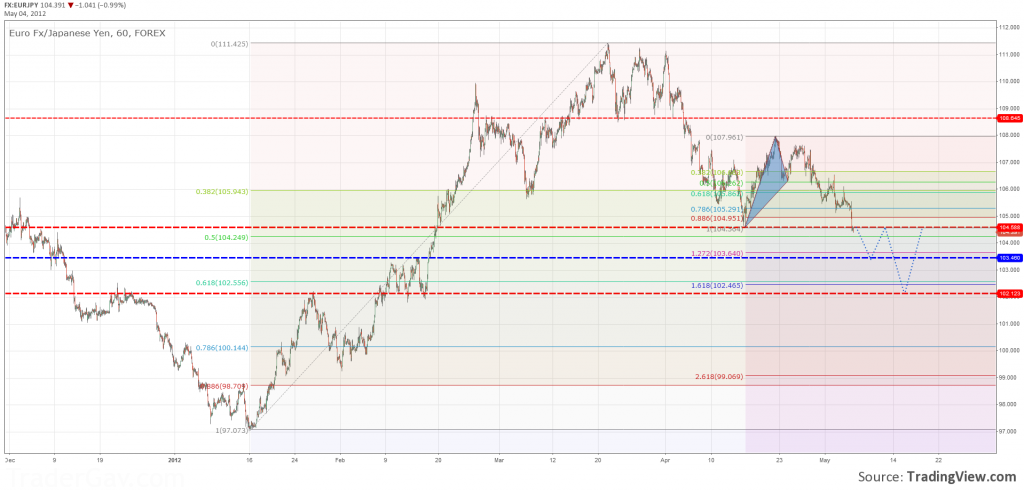
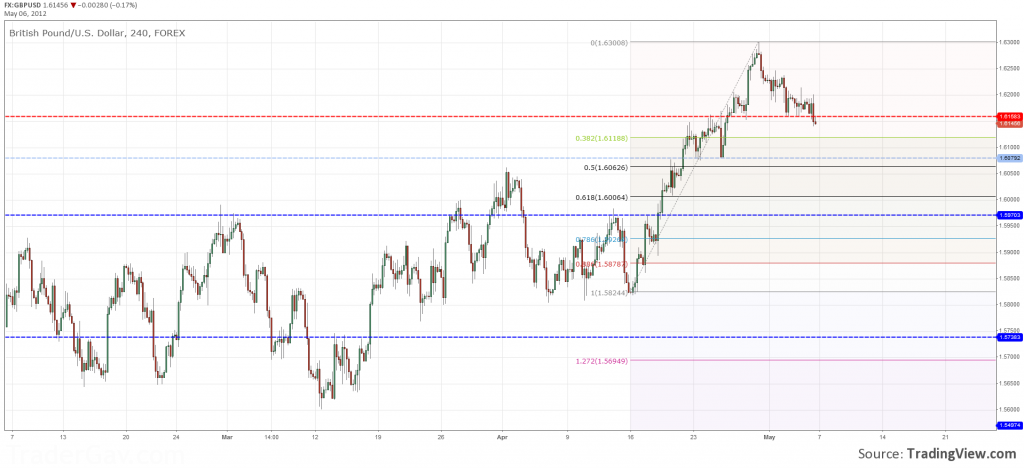
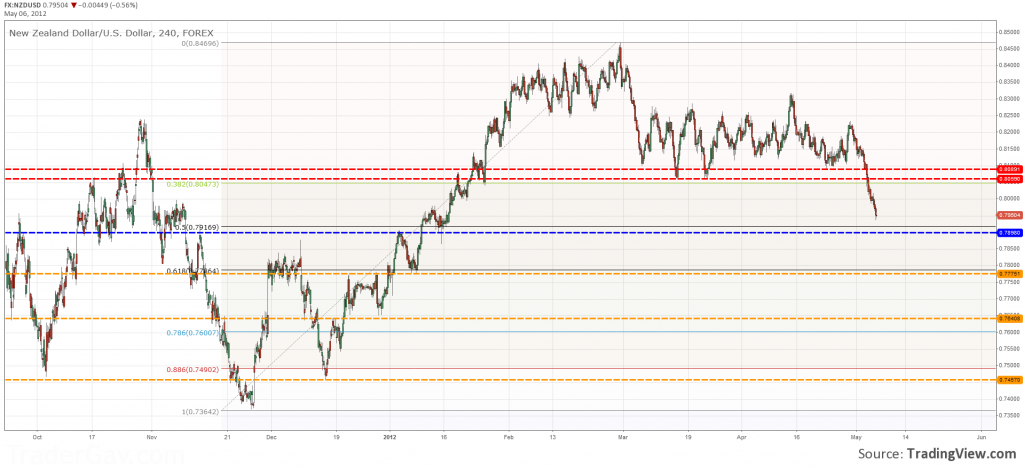
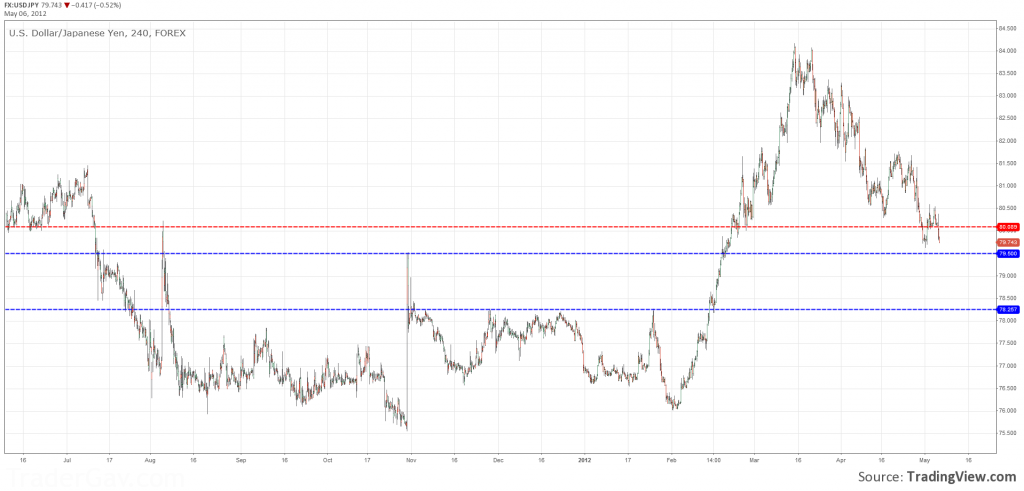
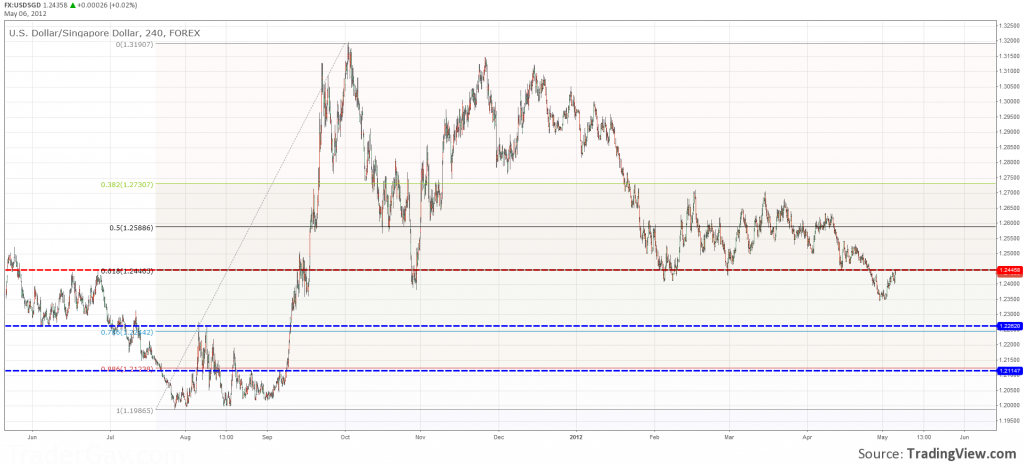
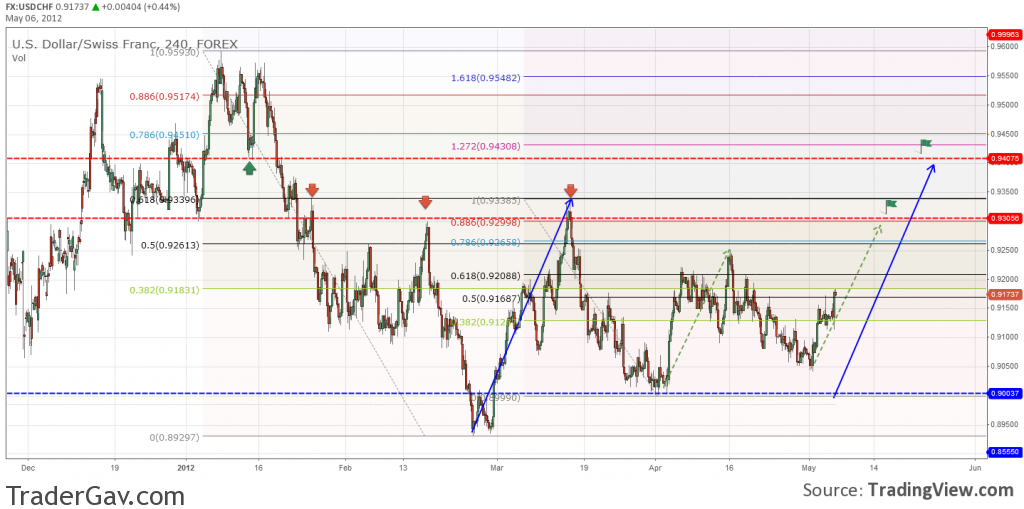
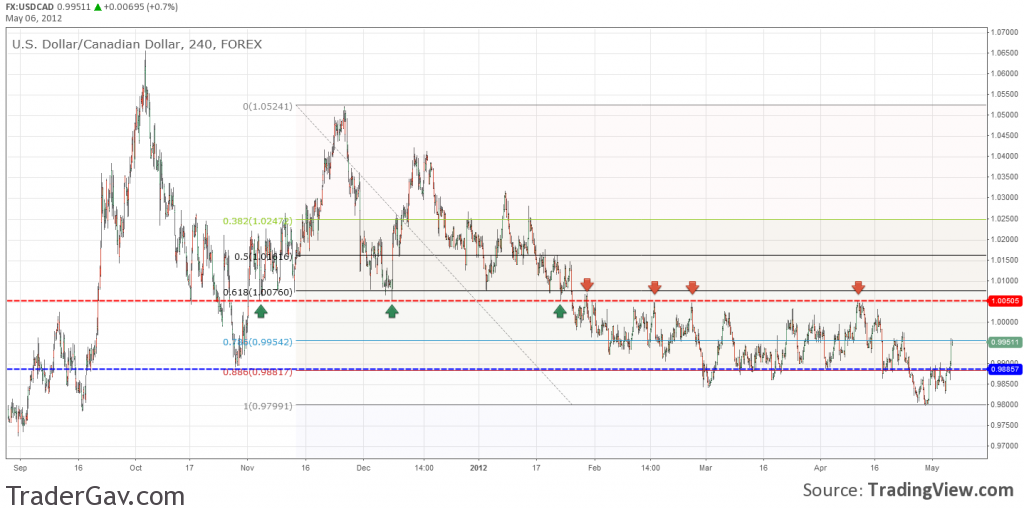
Here are the charts with some ‘annoying lines’ that I am watching for the coming week. Hope they annoy you as well.
$AUDUSD Hourly
$AUDJPY 240min

$EURUSD 240min
$EURAUD 240min
$EURJPY Hourly
$GBPUSD 240min
$NZDUSD 240min
$USDJPY 240min
$USDSGD 240min
$USDCHF 240min
$USDCAD 240min
Good trading!
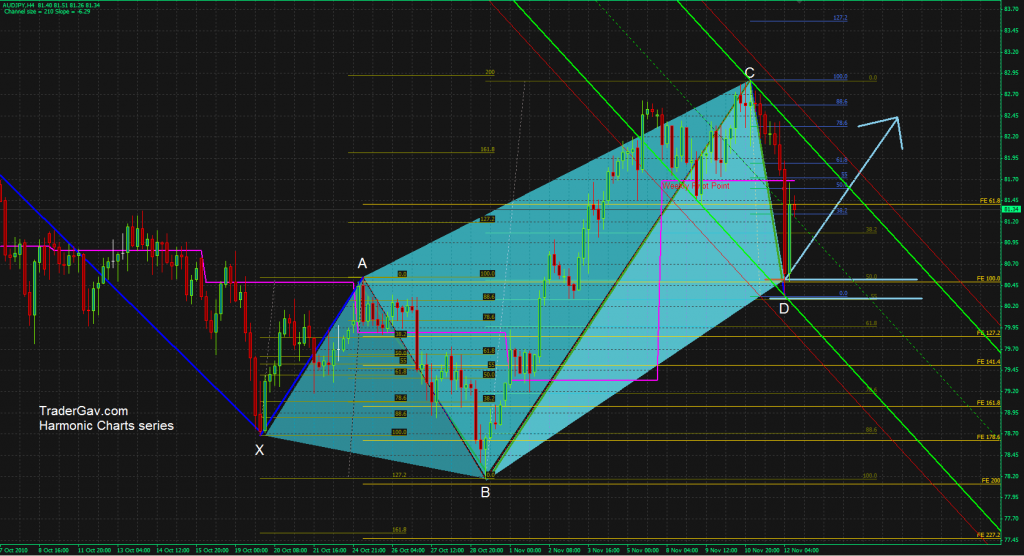
Here is the $AUDJPY chart I mentioned earlier on. I am holding long position, with some profit booked, and stop is now at break even. This is a text book 5-0 formation where all fib levels are nicely respected.
[tab: Setup]
Here is the chart to confuse you.
Have a great weekend!
[tab: Update 18 Nov 2010]
The pattern works now nicely. With the weakness of JPY at the moment, and AUD gaining some strength, the pair might stretch further. But, there is also a possibility of forming triple tops, and now it is trading at the top of channel as well…so..
Here is the updated chart.
I was watching AUDJPY. I thought it was going to invalidate the Bearish Butterfly formation. We had just broken out from the trading range yesterday, and now it renews my interest in shorting the pair. I am watching closely and preparing to build a swing short position.
what do you see here?
Here is the…CHART!
