• Skip to primary navigation
  • Skip to main content
  • Skip to primary sidebar
  • Skip to footer

TraderGav.com

Gav's trading blog - Perseverance, Consistency, Confidence

  • Home
  • Start Here
    • Back to Basics of Trading
    • Resource For Traders – The Best Tools for Traders
    • Learn Trading Articles
    • Sierra Chart Resource
  • Blog
    • Blog Posts
    • Other learning resource
    • Dummy Collection
    • Harmonic setups
  • About Me

NZDUSD

$NZDUSD 07 Jan 2011

by Gav Leave a Comment

So, this is the first post of the year. I am fortunate enough to have my weekly target hit during Tuesday and Wednesday session. And, we are expecting Non Farm Payroll at the end of the week, so I am not opening any new position for the rest of the week.

Any of my 12 readers observe the interesting setup forming in NZDUSD? I see a bullish harmonic setup in there. I thought it is not too difficult to see the confluence of Fib levels, support levels and Channel bands.

[tab: Initial Setup]

Here is the CHART!

Bullish Harmonic setup

[tab: Update 14 Jan 2011]

It was indeed a very slow trade. I was paying a lot of attention at the 76 level. It seemed to be bottoming at this level. It was. Kiwi broke out from the range during Thursday session, and first two profit targets were hit. I am now holding the last portion and looking a 78 as next target. Well, let’s see how it goes.

Here is the updated CHART!

NZDUSD Bullish harmonic setup

Filed Under: Harmonic setups, Trading Journal Tagged With: 5-0, FX, NZDUSD, Trading Journal

$NZDUSD 26 Nov 2010

by Gav Leave a Comment

While the NZDJPY setup is still valid, I have another bullish setup found in NZDUSD. Again, I see confluence of Fib levels, support level, bottom of channel as well as my favorite bullish harmonic formation.

[tab: Setup 26 Nov 2010]

Here is the chart to confuse you.

$NZDUSD Bullish Harmonic setup

[tab: Update 28 Nov 2010]

The reversal zone of  the original harmonic setup was violated, no sign of reversal in the zone, so, no entry yet. However, while I was zooming out the chart, to look at a bigger picture, another bullish harmonic formation is setting up. Still, I see confluence of support and Fib levels at the channel band.

Here is another chart to confuse you, yet, again.

$NZDUSD 27 Nov 2010 Bullish Harmonic setup

Filed Under: Harmonic setups, Trading Journal Tagged With: bullish gartley, FX, NZDUSD, Trading Journal

Updated chart of $NZDUSD 13 September 2010

by Gav Leave a Comment

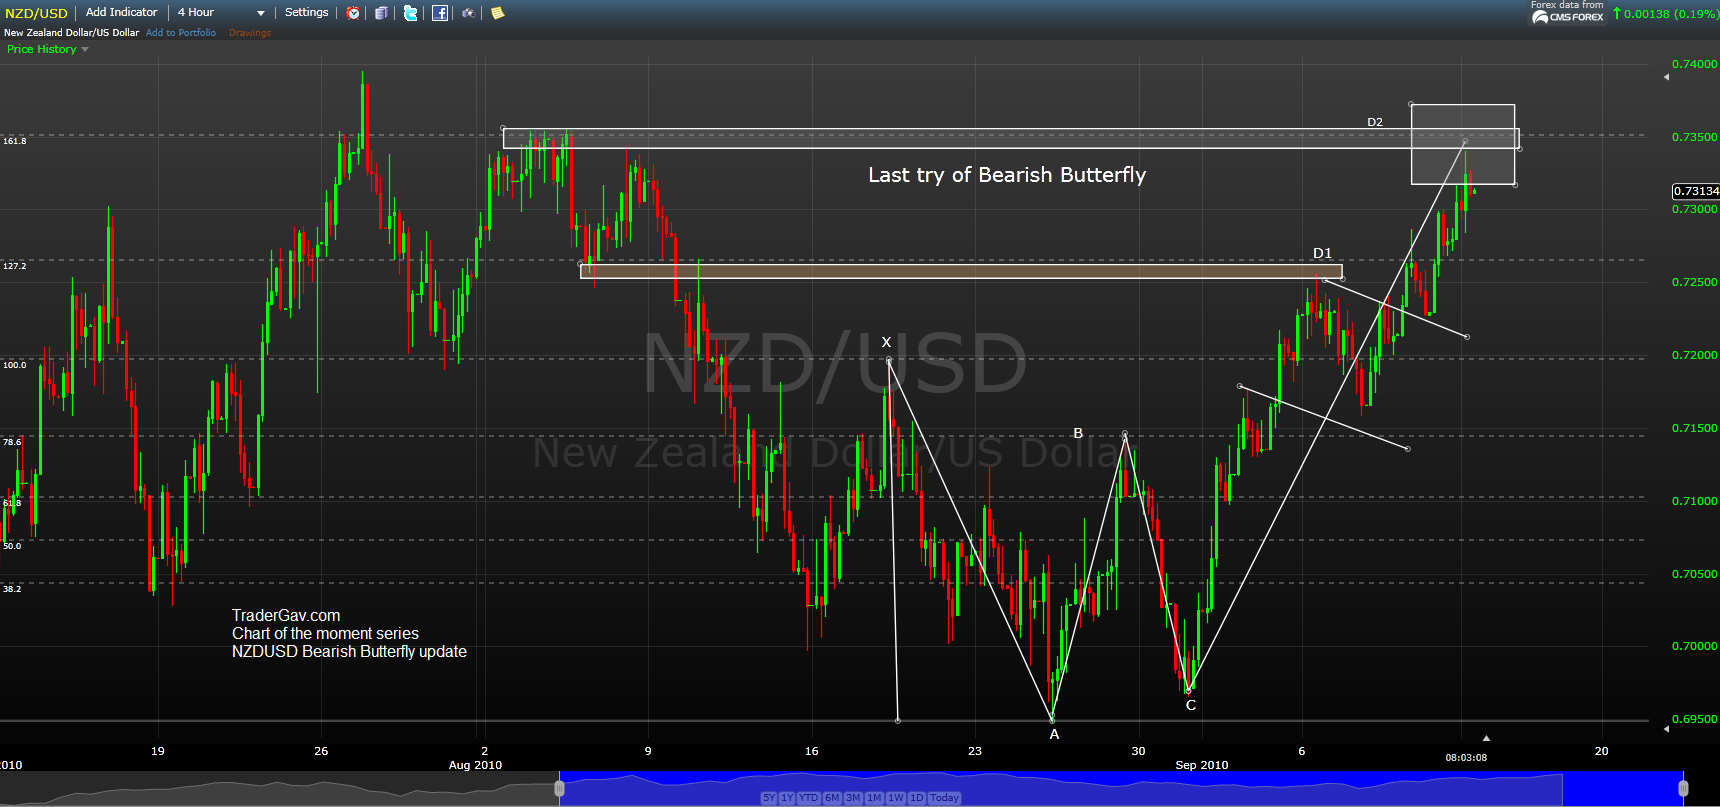
So now we are in the vicinity of 161.8%, and the last valid D of Bearish butterfly. Kiwi touched 0.7345 during Monday London session. We shall see if the pattern is to hold or invalidated soon. Short stop is above 0.7350

Here is the updated Chart, the Butterfly.

NZDUSD Bearish Butterfly

Filed Under: Harmonic setups, Trading Journal Tagged With: Bearish Butterfly, Chart of the moment, FX, NZDUSD, Trading Journal

Updated Chart of $NZDUSD Bearish Butterfly

by Gav Leave a Comment

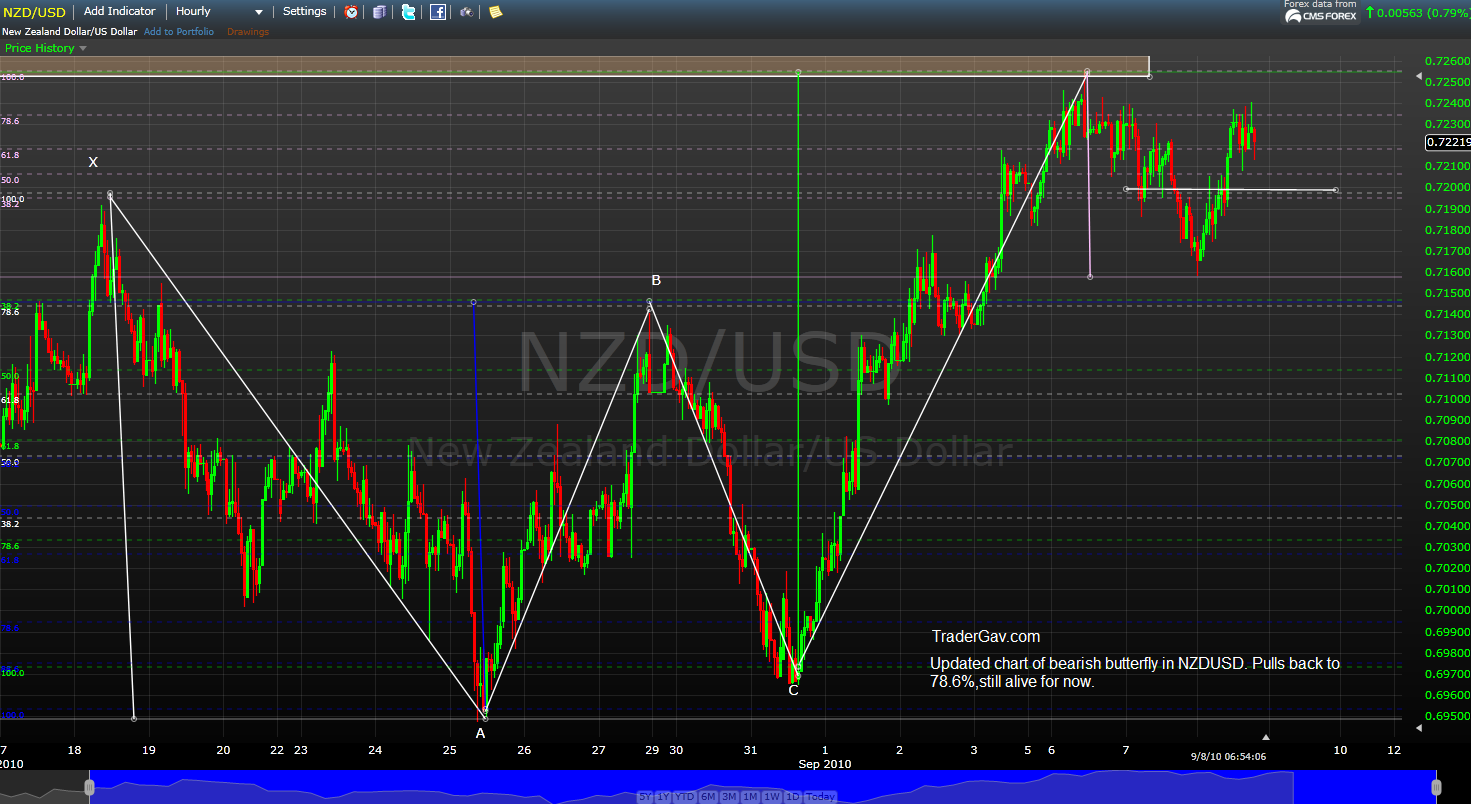
This is the quick update of my previous post of $NZDUSD. Kiwi dollar pulled back to 78.6% of the most recent down swing, the risk was back in town during the Wednesday session. And the bearish Butterfly pattern is still alive for now. I am watching the development of this pattern.

As always, it is easy to find a chart pattern or setup, but the essential skill is to learn how to manage a position. One setup, one pattern, can lead to different sets of result.

Here is the updated chart.

Again, here are some details of the pattern recognition I found it on FX360. Check out the website for details.

The bearish butterfly Pattern Rules

  1. The swing from A to D is a 127.2% or 161.8% extension of XA
    • Note: D must be above X
  2. A valid ABCD must be observed in the extension move (AD)
  3. Additional confirmation may be attained when the times of the XAB and BCD triangles are in proportion
  4. A move beyond 161.8% negates the pattern and may suggest a potentially strong bullish continuation

Filed Under: Harmonic setups, Trading Journal Tagged With: Chart of the moment, FX, NZDUSD, Trading Journal

Chart of the moment: $NZDUSD, a Bearish Butterfly it is

by Gav Leave a Comment

Here is what I see in Kiwi dollar ($NZDUSD). We are looking at a bearish butterfly pattern now, well, in case you are into harmonic pattern.

Again, is the chart trying to tell you something?

Trade well.

Filed Under: Harmonic setups, Trading Journal Tagged With: Bearish Butterfly, Chart of the moment, FX, NZDUSD, Trading Journal

Chart of the moment: $NZDUSD 06 August 2010

by Gav Leave a Comment

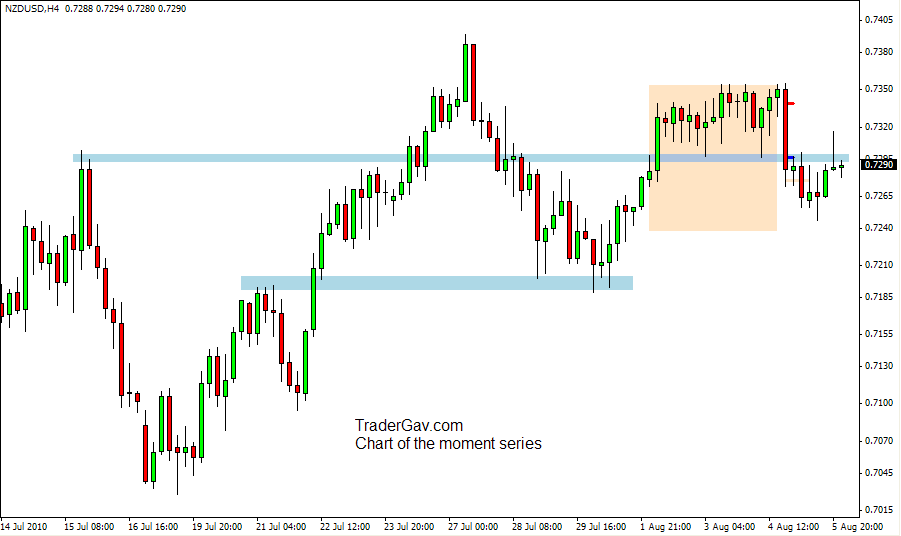
I am not trading today, but still watching the markets. During my morning chart reading, NZDUSD again pops up. I shorted it yesterday, and position was closed. Kiwi dollar was back to 73c during Thursday U.S session. And, again, 73 cents blocked it.

Here is the CHART. Do you see anything interesting?

Enjoy! I am going for my cup of Espresso now 🙂

Filed Under: Chart of the moment, Trading Journal Tagged With: Chart of the moment, NZDUSD, Trading Journal

  • « Go to Previous Page
  • Page 1
  • Page 2
  • Page 3
  • Page 4
  • Page 5
  • Go to Next Page »

Primary Sidebar

Best Tools For Traders

Recommend FX Charting

Footer

Recommended FX Charting

Recommended Training

FXSAnalytics
Price Action Course for Professionals

Copyright © 2025 · Affiliate Disclosure · Privacy

We use cookies to ensure that we give you the best experience on our website. If you continue to use this site we will assume that you are happy with it.Ok