
I was alerted by @NicTrades on twitter about the Bullish Gartley formation in the daily chart of GBPUSD. Here is my chart, with addition trend line retests are observed. Here is the ….. CHART!
bullish gartley
$NZDUSD 26 Nov 2010
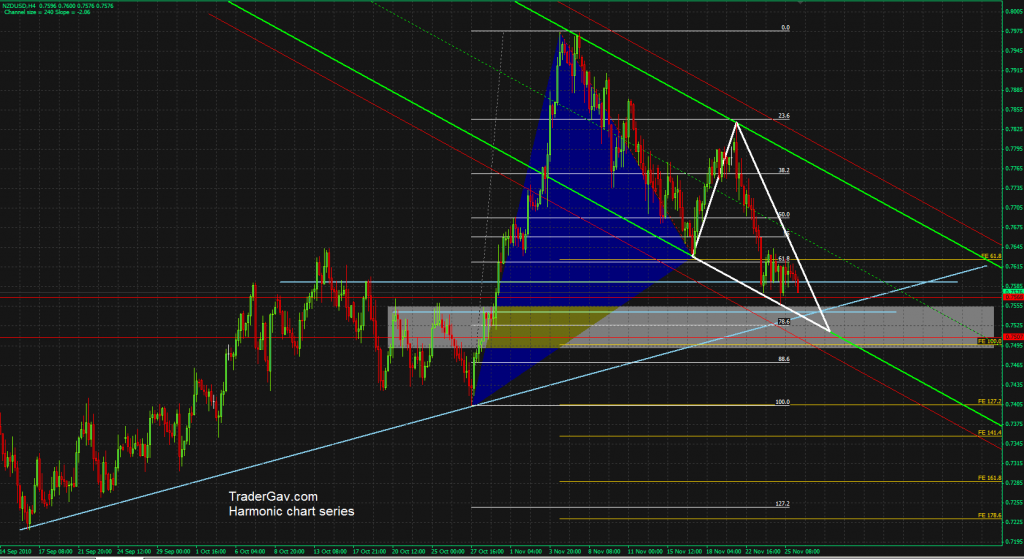
While the NZDJPY setup is still valid, I have another bullish setup found in NZDUSD. Again, I see confluence of Fib levels, support level, bottom of channel as well as my favorite bullish harmonic formation. [tab: Setup 26 Nov 2010] Here is the chart to confuse you. [tab: Update 28 Nov 2010] The reversal zone […]

