• Skip to primary navigation
  • Skip to main content
  • Skip to primary sidebar
  • Skip to footer

TraderGav.com

Gav's trading blog - Perseverance, Consistency, Confidence

  • Home
  • Start Here
    • Back to Basics of Trading
    • Resource For Traders – The Best Tools for Traders
    • Learn Trading Articles
    • Sierra Chart Resource
  • Blog
    • Blog Posts
    • Other learning resource
    • Dummy Collection
    • Harmonic setups
  • About Me

Gold

Chart Review GOLD (XAUUSD) 17 Jul 2013

by Gav Leave a Comment

I always prefer to look at GOLD chart at the bigger time frame. It gives me a better picture. Let’s have a look at Spot GOLD (XAUUSD).

Here is the Daily chart of Spot GOLD (XAUUSD). It is trading slightly below 1300 area. My immediate upside target is around the 1337ish which is also the 61.8% Fib retracement with confluence of the upper band of daily channel and previous support turns resistance level.

GOLD D1 17Jul2013
17Jul2013

In the perfect scenario (which rarely happens..), I am looking at the resume of downtrend at the resistance zone mentioned above, and continue moving to complete the 1 to 1 projected movement (as shown in the green lines)

Let’s look into more detailed H4 chart.

A potential harmonic pattern is observed in H4. At the same resistance zone around 1337, as observed from Daily time frame, a bearish Gartley is forming. Although it is important to note 1300 will provide some pretty good support should GOLD break up from here.

GOLD H4 17Jul2013
GOLD H4 17Jul2013


That’s it, we have marked down some important levels to watch, and potentially do some businesses. Let’s “wait and see” now.

Filed Under: Harmonic setups, headline post, Trading Journal Tagged With: ABCD, Bearish Gartley, Gold

GOLD 25 September 2012

by Gav Leave a Comment

I think there are probably 10,000 charts talking about the daily “Pin bar” of GOLD lately. I am not the expert of “Pin bar”, I do notice the long tail tested the resistance level and failed to close above it. Anyway, looking into shorter time frame, we have a support zone around 1755. More conservative play will be waiting for the break of this level, and get in during� pull back. Well, if it pulled back.

Here is the 4 hour chart. (click to view full chart)

$GOLD H4

Filed Under: Support Resistance, Trading Journal Tagged With: Gold, Key Levels, Trading Journal

Key Levels for week 14 Feb 2011

by Gav Leave a Comment

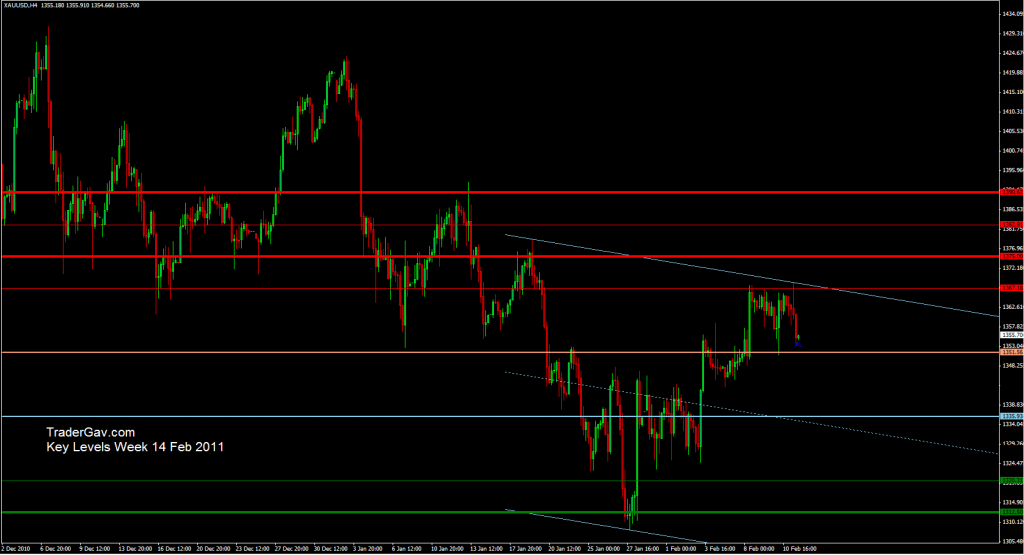
Here are the pairs and the key levels that I’ll be watching for the coming week. These are basically support and resistance levels. Since I am mostly trading off 4-hour charts, I am only posting charts of this time frame here.

Have a great trading week ahead!

[tab: GOLD]

GOLD Key levels

[tab: AUDUSD]

AUDUSD Key Levels

[tab: EURGBP]

EURGBP Key Levels

[tab: EURUSD]

EURUSD Key Levels

[tab: GBPUSD]

GBPUSD Key levels

[tab: NZDUSD]

NZDUSD Key Levels

[tab: USDCAD]

USDCAD Key Levels

[tab: USDCHF]

USDCHF Key Levels

Filed Under: Trading Journal Tagged With: AUDUSD, EURGBP, EURUSD, FX, GBPUSD, Gold, Key Levels, NZDUSD, Trading Journal, USDCAD, USDCHF, XAUUSD

GOLD $GLD 02 Dec 2010

by Gav Leave a Comment

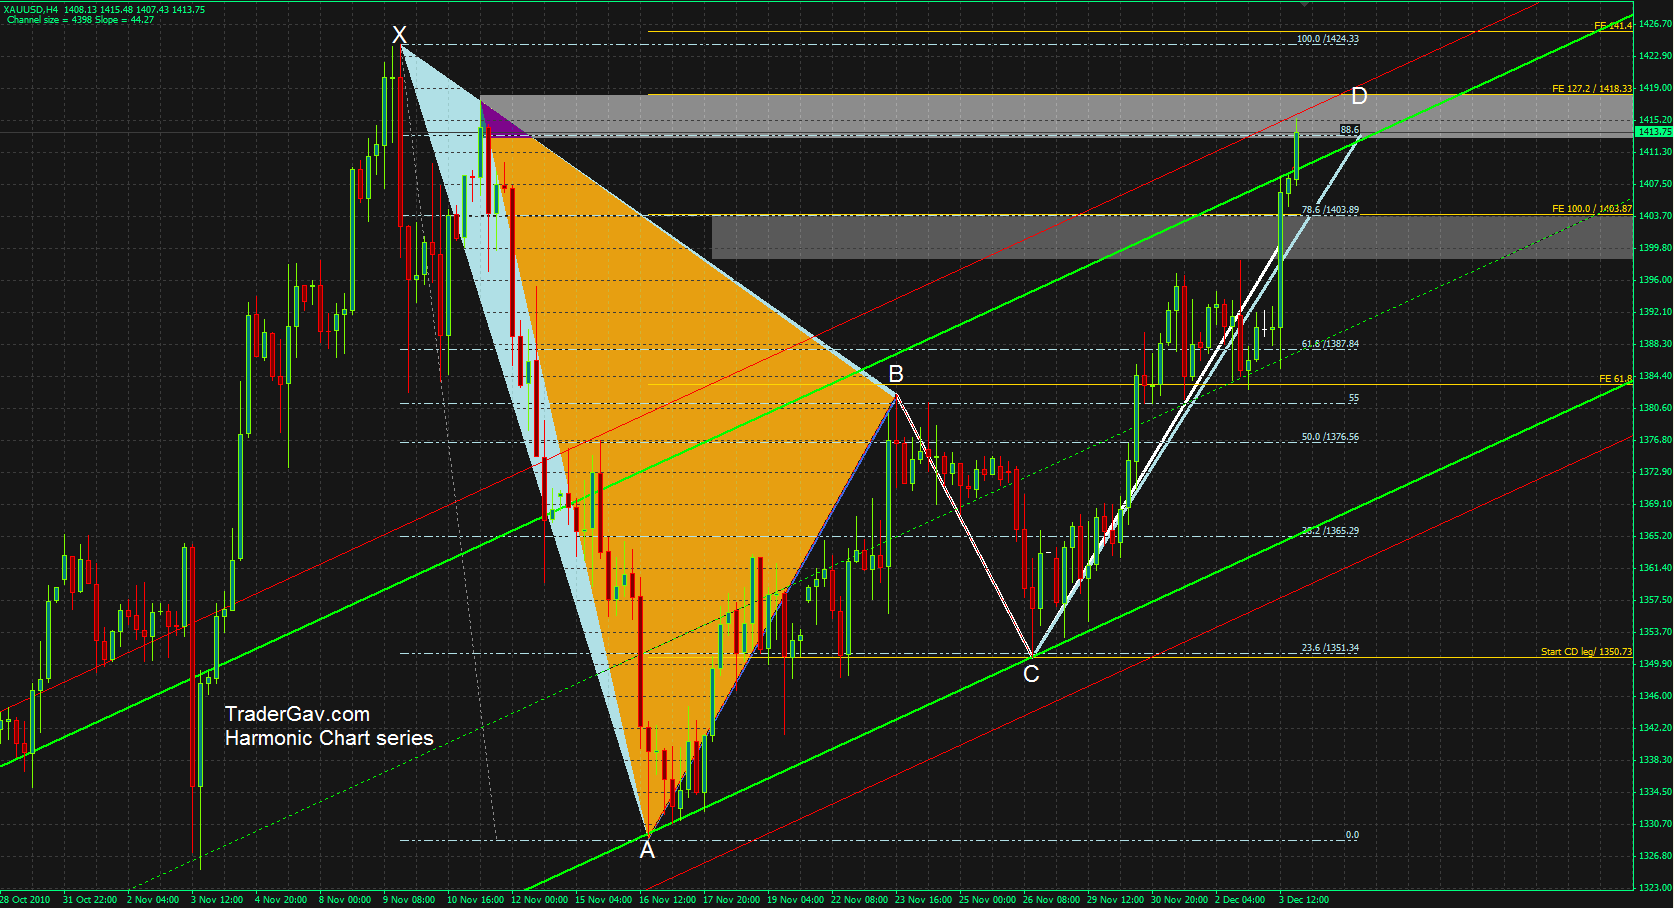
Here is the GOLD chart that I am looking at.  I see confluence of resistance level, channel, Fib levels, and harmonic formation.

I am keen to watch 1400 before deciding if to go short.

[tab: Initial Setup]
Here is the chart…… to confuse you.

$GLD bearish harmonic setup

[tab: Update 05 December 2010]

The initial bearish harmonic setup was invalidated after NFP announcement. GOLD fired through 1400 level. At the Friday close, I observed another bearish harmonic formation. The formation will be invalidated again if ‘X’ is violated.

Here is another chart….to CONFUSE you.

$GLD GOLD Bearish Harmonic setup

Filed Under: Harmonic setups, Trading Journal Tagged With: ABCD, Bearish Gartley, FX, Gold, Trading Journal

$GLD GOLD 08 Nov 2010

by Gav Leave a Comment

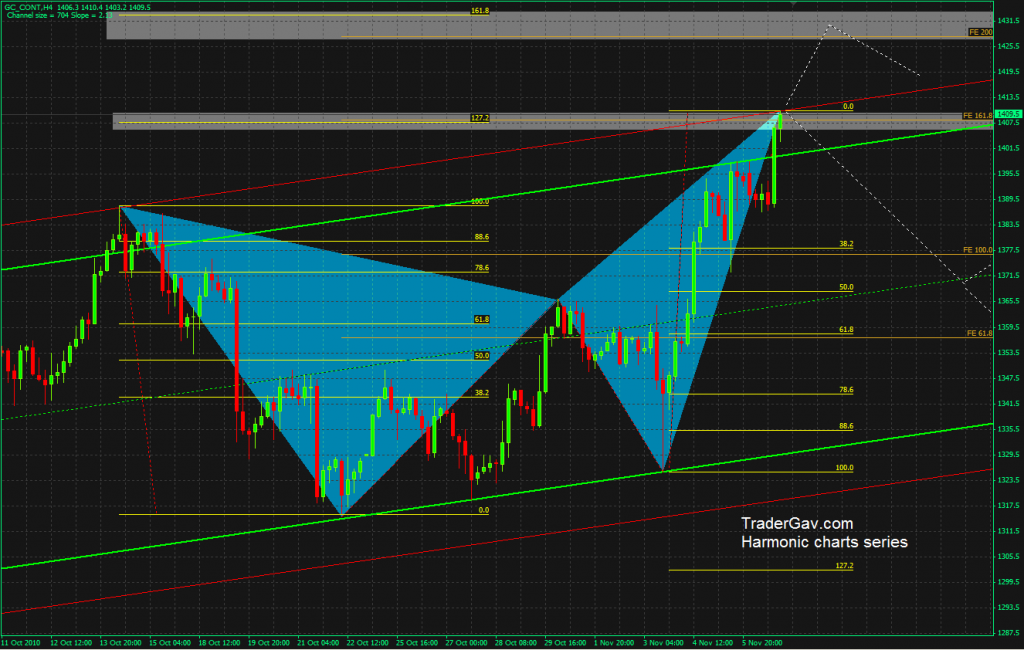
I am looking at GOLD chart this morning, I got the feeling it might be the time to see some corrections soon. It is now trading around the top of the recent channel, and there are confluences of Fib extensions and harmonic patterns. I have two potential zones defined on my chart. Let’s see how it works out.

[tab: Setup]

Here is the CHART to confuse you.

GOLD 08 Nov 2010

Define your level, and trade the level.

Trade well.

[tab: Update 13 Nov 2010]

Here is the updated GOLD chart.  We have a pretty nice pull back of GOLD (not without some initial shaking though)

$GLD Bearish harmonic action

Filed Under: Harmonic setups Tagged With: ABCD, Bearish Butterfly, Chart of the moment, FX, Gold, Trading Journal

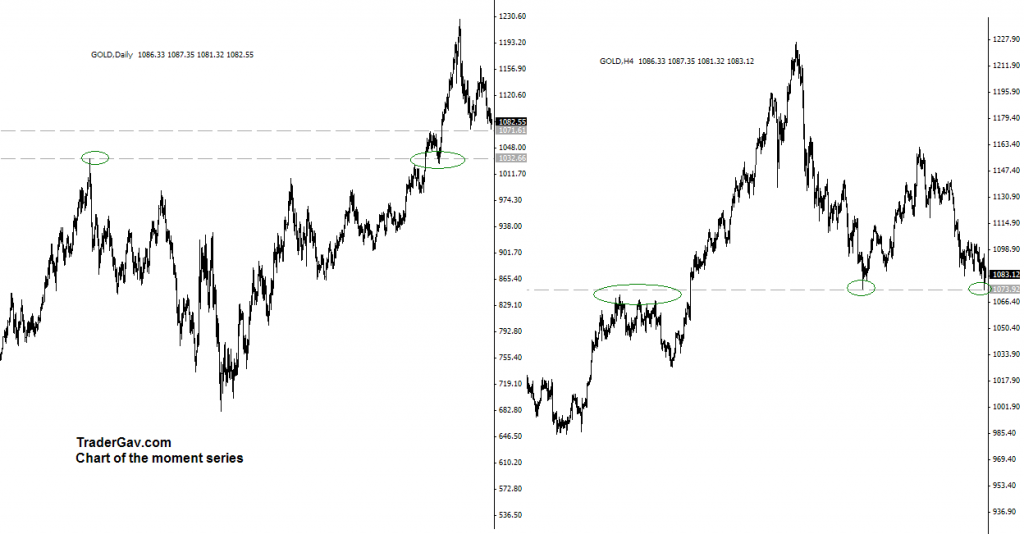
Is it time now? A look at GOLD ($XAU)

by Gav Leave a Comment

I exited my AUDUSD long position earlier today with small loss. The entry was too early. However, I am still looking to build long positions of AUD, NZD and CAD (by Short USDCAD). Let’s see how this strategy works out. Basically, my approach is to test the market, if it does not work out, I run, building another position. No scalping though. OK, I am talking too much now.

I had a look at GOLD. This is another reason I am interested in building long positions of commodities currencies. Well, though this is not the only factor. Take a look at Daily and 4-hr, what do you see? Is it going to break or bounce?

Here is the chart (click to view full chart)

Here are some technical figures:

About this tool

Filed Under: Chart of the moment, Trading Journal Tagged With: AUDUSD, Chart of the moment, FX, Gold, NZDUSD, Trading Journal, USDCAD

  • Page 1
  • Page 2
  • Page 3
  • Page 4
  • Go to Next Page »

Primary Sidebar

Best Tools For Traders

Recommend FX Charting

Footer

Recommended FX Charting

Recommended Training

FXSAnalytics
Price Action Course for Professionals

Copyright © 2025 · Affiliate Disclosure · Privacy

We use cookies to ensure that we give you the best experience on our website. If you continue to use this site we will assume that you are happy with it.Ok