I always prefer to look at GOLD chart at the bigger time frame. It gives me a better picture. Let’s have a look at Spot GOLD (XAUUSD).
Here is the Daily chart of Spot GOLD (XAUUSD). It is trading slightly below 1300 area. My immediate upside target is around the 1337ish which is also the 61.8% Fib retracement with confluence of the upper band of daily channel and previous support turns resistance level.

In the perfect scenario (which rarely happens..), I am looking at the resume of downtrend at the resistance zone mentioned above, and continue moving to complete the 1 to 1 projected movement (as shown in the green lines)
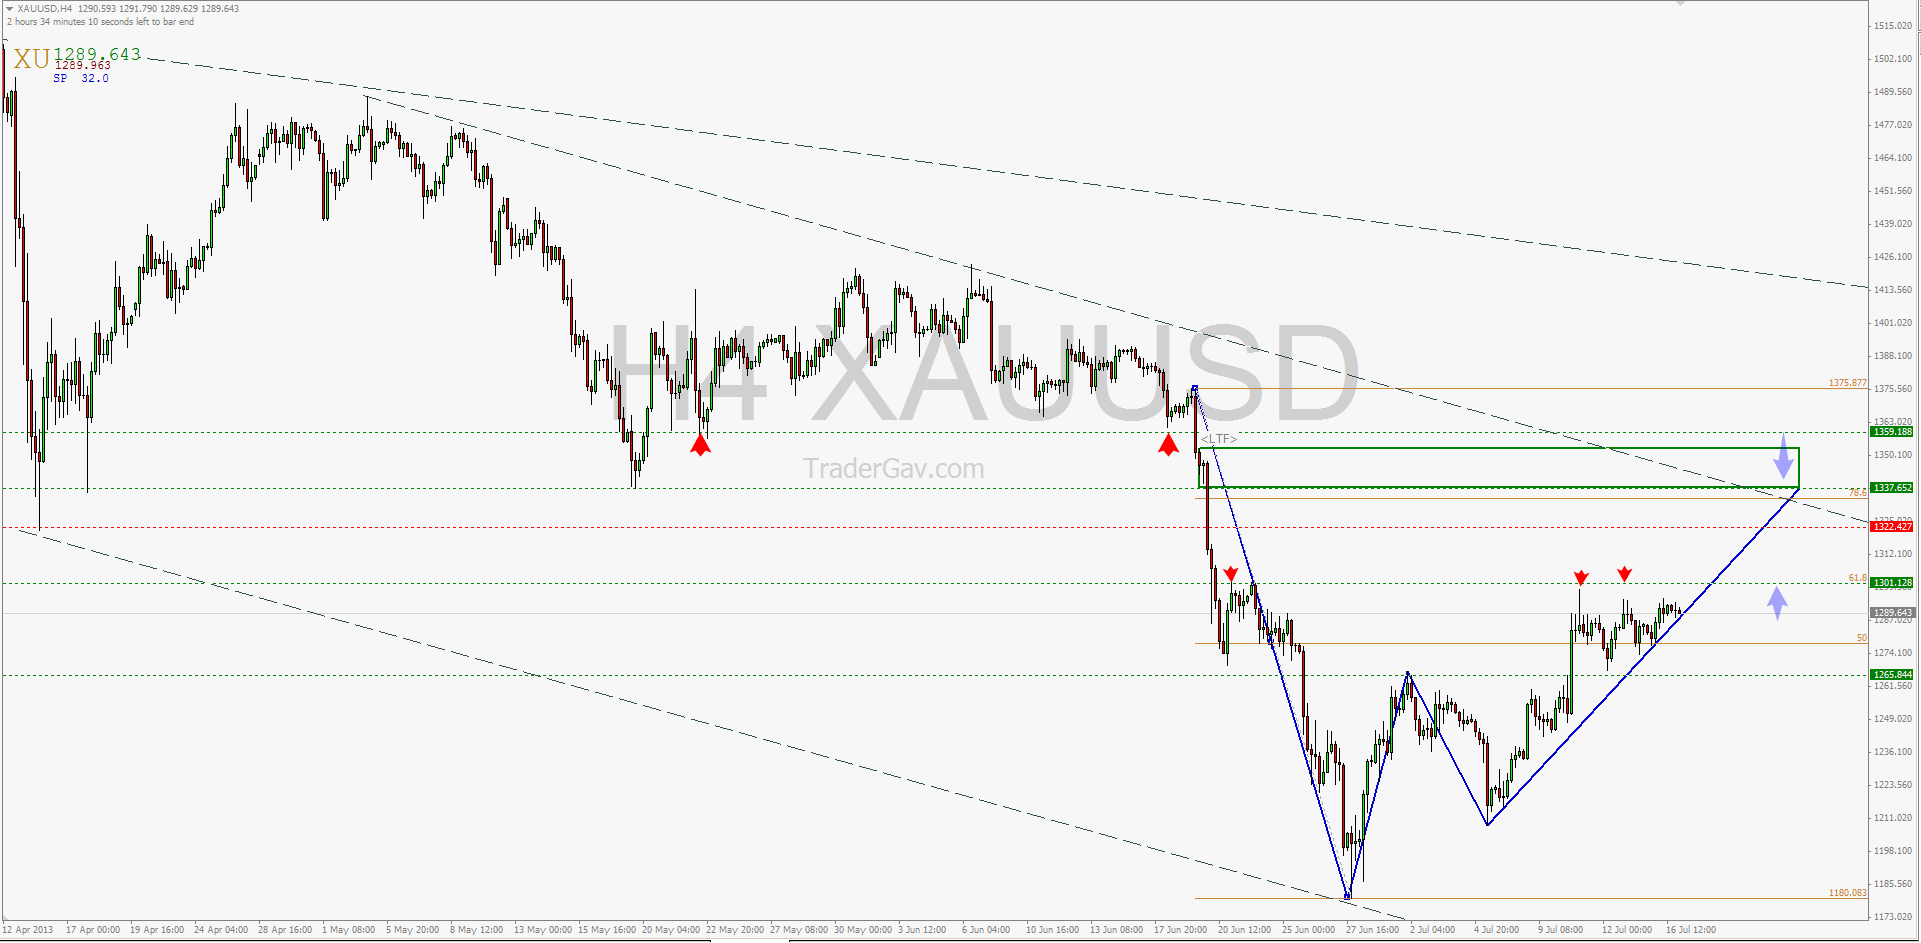
Let’s look into more detailed H4 chart.
A potential harmonic pattern is observed in H4. At the same resistance zone around 1337, as observed from Daily time frame, a bearish Gartley is forming. Although it is important to note 1300 will provide some pretty good support should GOLD break up from here.

That’s it, we have marked down some important levels to watch, and potentially do some businesses. Let’s “wait and see” now.


Leave a Reply