
Here is the USDJPY chart. I am looking at 83 area for potential short trade. There are confluences of Fib extensions, harmonic patterns formation, and price resistance area. Here is the chart to confuse you.
Bearish Butterfly
$GLD GOLD 08 Nov 2010
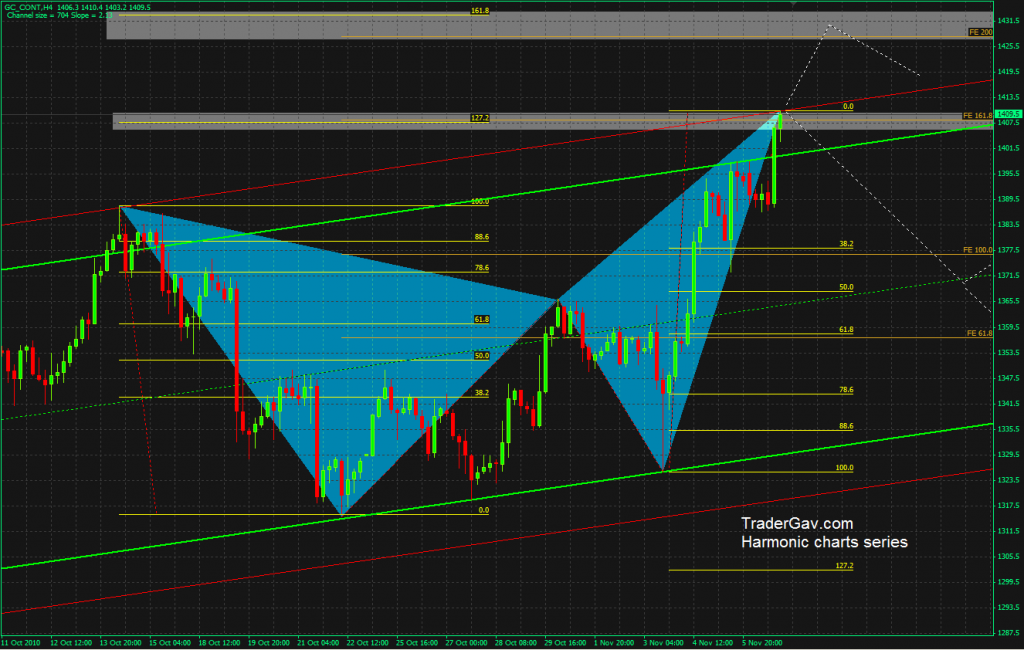
I am looking at GOLD chart this morning, I got the feeling it might be the time to see some corrections soon. It is now trading around the top of the recent channel, and there are confluences of Fib extensions and harmonic patterns. I have two potential zones defined on my chart. Let’s see how […]
$GBPJPY 04 Nov 2010

Let’s have a look at the beast, $GBPJPY. I see some confluences of Fib levels, resistance levels and harmonic pattern formation. I am interested in getting in some shorts around 131.80 level or slightly above this level. Let’s see.. [tab: Setup] Here is the…. CHART! [tab: Trade update] No update at the moment, come back […]
$EURUSD 04 Nov 2010
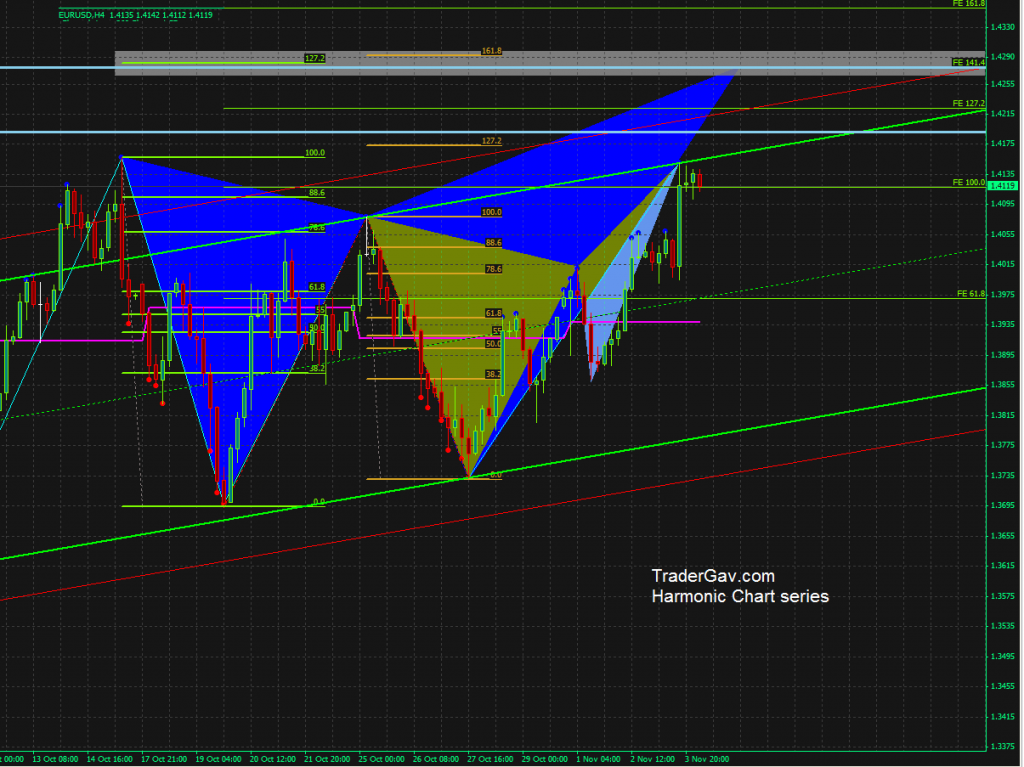
Here is what I see in $EURUSD now. I might be completely wrong and miss the move, but I would prefer to get in short position somewhere near 1.4250 to 1.43 level. I see the confluence of Fib levels, resistance zone in weekly chart, and a harmonic pattern. I’ll be looking at this setup closely […]
Something about $AUDJPY 20102010
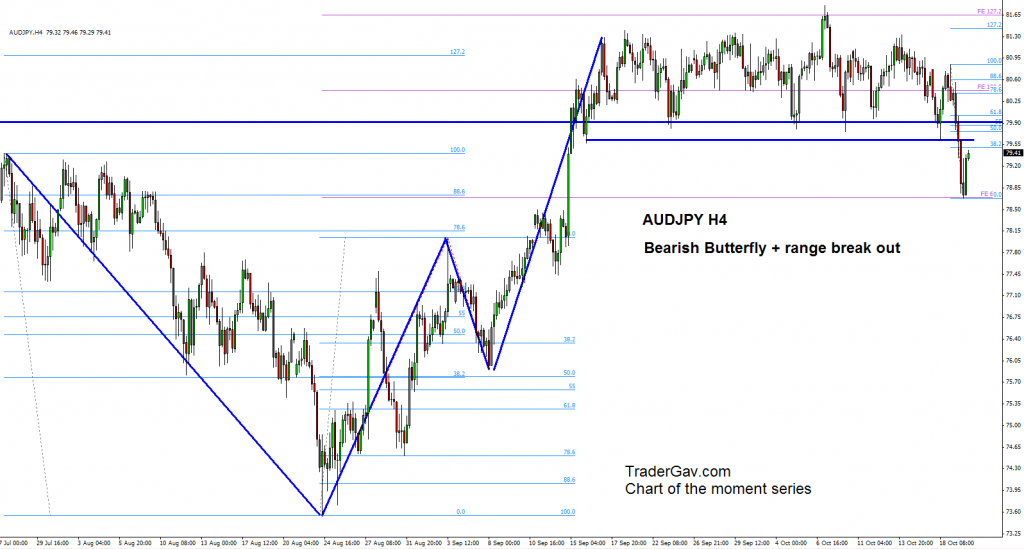
I was watching AUDJPY. I thought it was going to invalidate the Bearish Butterfly formation. We had just broken out from the trading range yesterday, and now it renews my interest in shorting the pair. I am watching closely and preparing to build a swing short position. what do you see here? Here is the…CHART!
Another look of $EURGBP, the big picture 17 Oct 2010

Let’s have a look at the weekly chart of $EURGBP. We have a pennant forming, with ABCD and Bullish Butterfly formations within. It is just so beautiful. I see two possibilities here. First, we might start to have correction right now with 88 level as immediate resistance. Second, we might have another leg and approach […]

