A bearish harmonic setup is observed while NZDUSD is retesting the broken trend line. Bias remains short for now.
NZDUSD
$NZDUSD 17 August 2011
I maintain my short bias of $NZDUSD for now after the established uptrend line was broken earlier this month. The broken trend line was retested and acted as resistance. I have been making some daytrades for the past couple of days. However, for the bigger picture, I am now looking at a potential swing trade, […]
Key Levels to watch for Week 21 Feb 2011
Here are the currency pairs and the key levels on my watch list for this week. I am not sure if I have any extra energy to trade this week, since I am busy preparing for next week’s house moving. Anyway, that’s not the point of this post. Again, these levels are just support/resistance that […]
$NZDUSD 15 Feb 2011
NZDUSD is currently trading in an interesting zone. We have a bullish harmonic formation and the confluence of key support levels, and daily rising trend line. If a bounce from here happens, I have two possible scenarios. 1st is a pull back and then continuation of bearish symmetrical movement (Refer to the yellow lines). 2nd […]
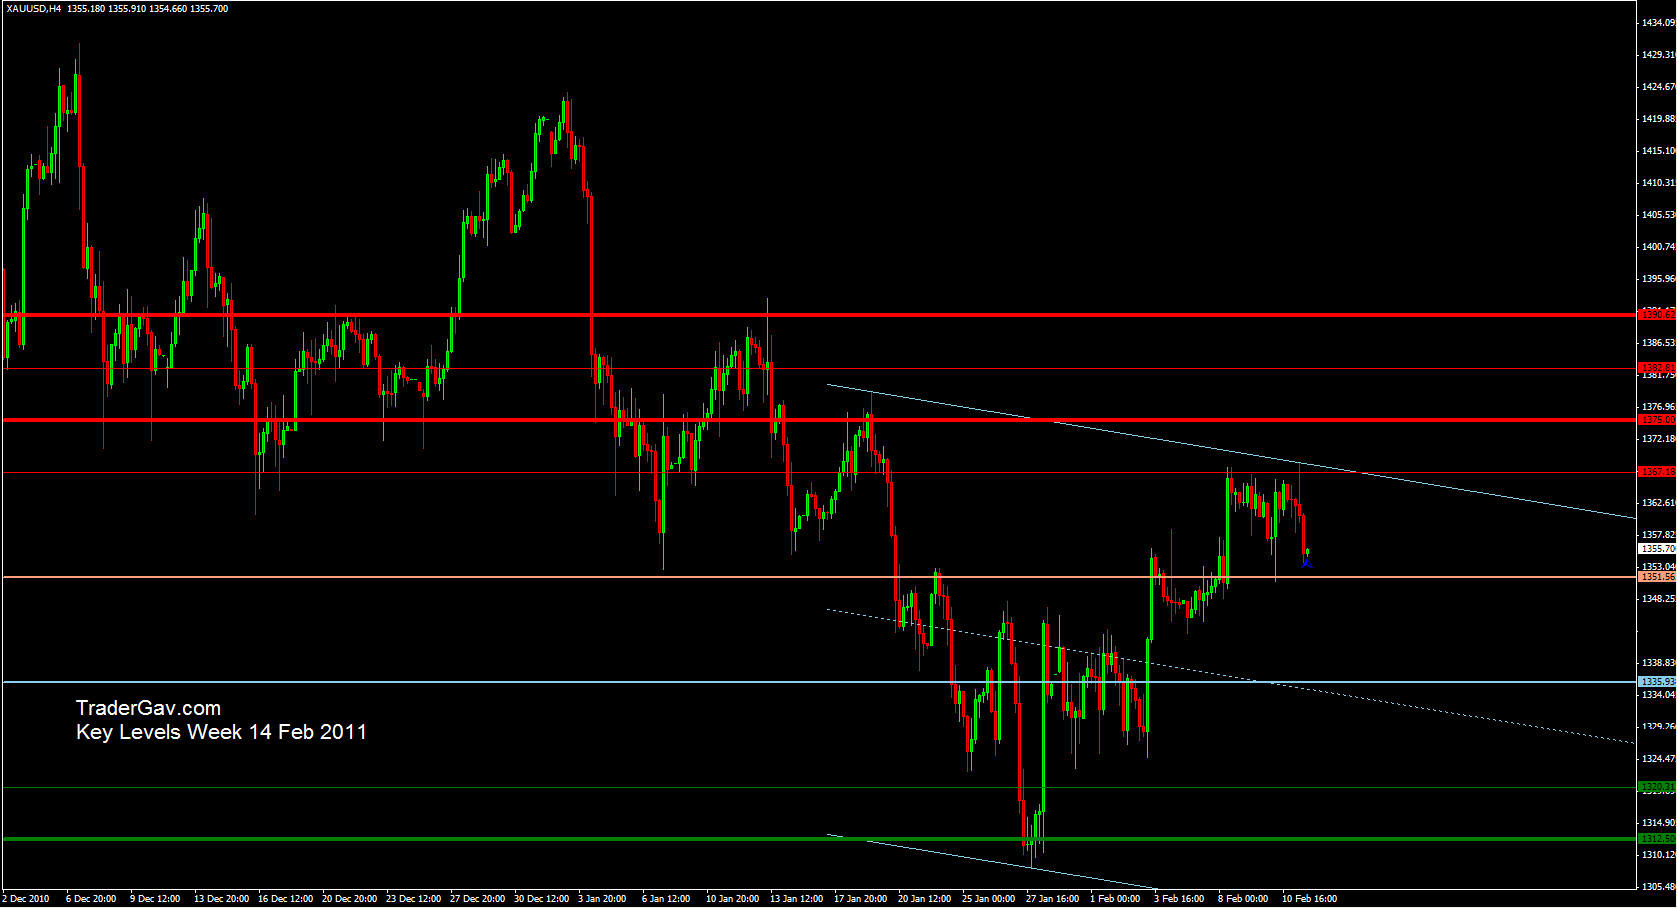
Key Levels for week 14 Feb 2011
Here are the pairs and the key levels that I’ll be watching for the coming week. These are basically support and resistance levels. Since I am mostly trading off 4-hour charts, I am only posting charts of this time frame here. Have a great trading week ahead! [tab: GOLD] [tab: AUDUSD] [tab: EURGBP] [tab: EURUSD] […]
Key Levels to watch Week 07 Feb 2011
I am testing a new idea, so for limited time, I am posting key levels of some major pairs that I am trading frequently. These are basically support and resistance levels. If any of my 12 readers finds these to be useful, shoot me a comment, we’ll see what we can do with these. I […]


