
Here is the $NZDJPY daily chart after NY session close yesterday. Very nice reaction at 65.50 ish zone. The major roadblock is seen at 64.30 ish zone now. It is a strong support zone formed by previous highs. Here is the…..CHART!
NZDJPY
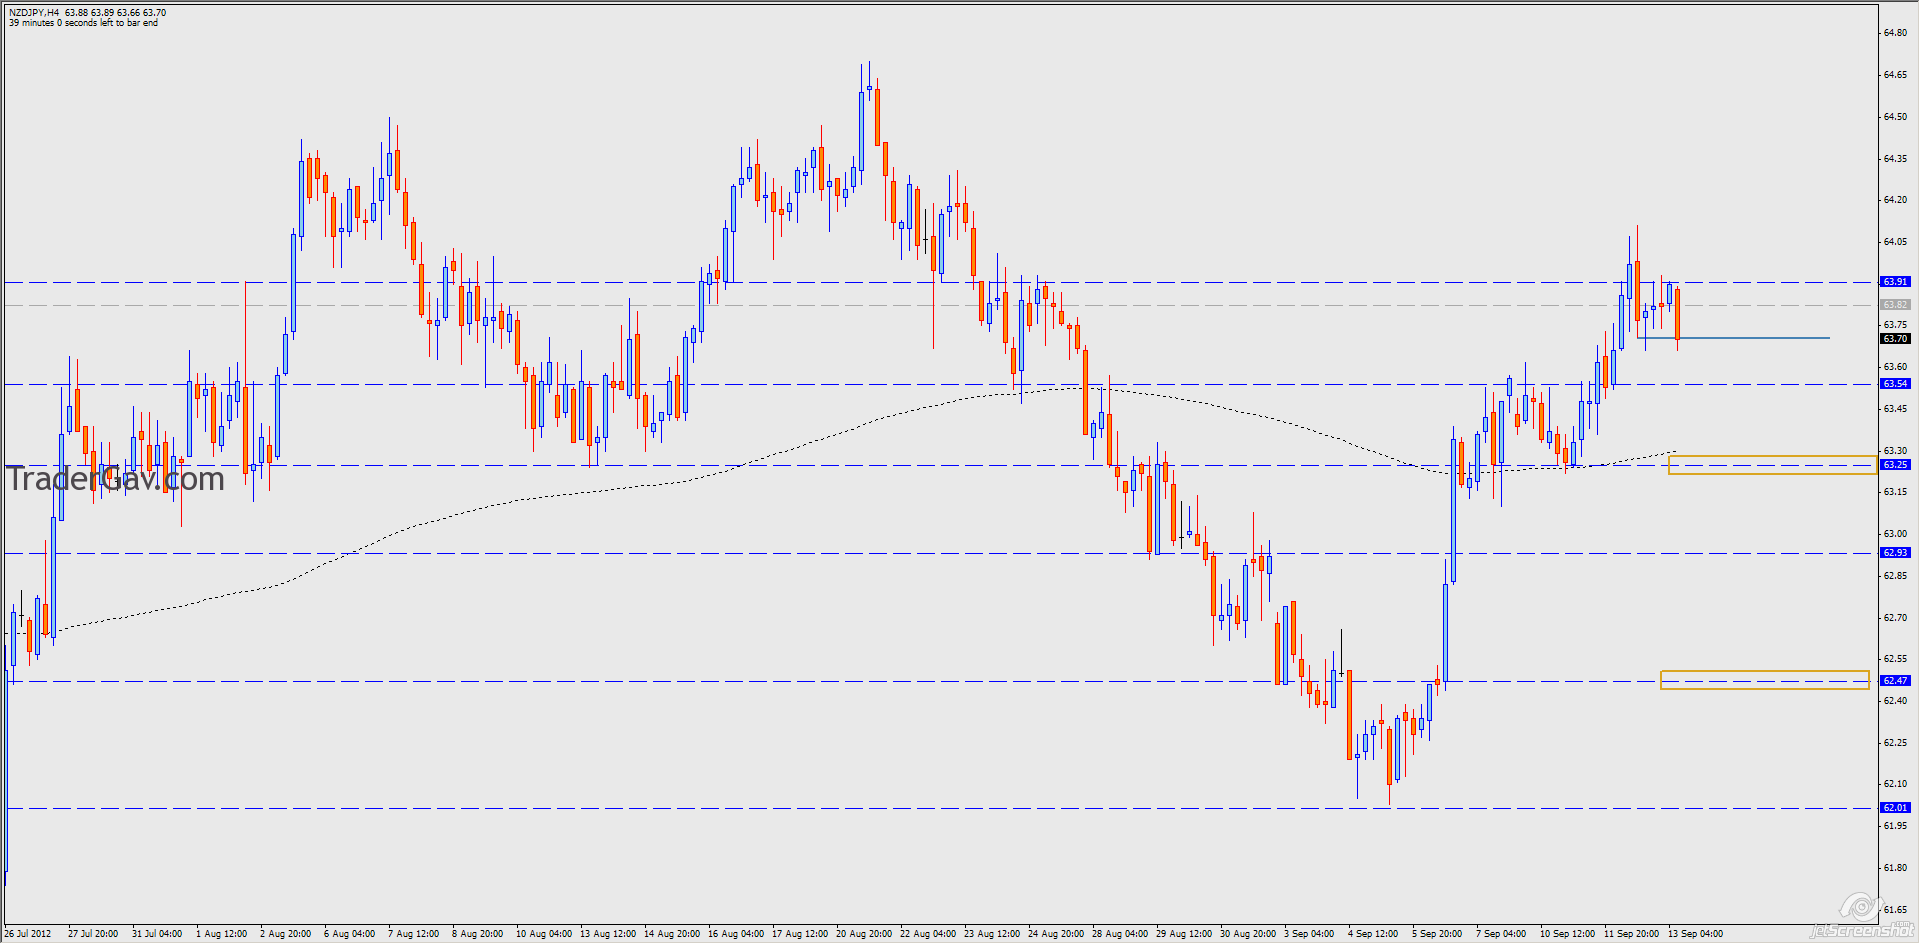
$NZDJPY 13 September 2012
NZDJPY looks interesting to me. A potential short. Just be aware high impact events (FOMC statement) later today.
A follow up of $NZDJPY

I don’t normally post detailed result of my trades. I just thought this chart is a beauty. Referring to the previous post for the short setup of NZDJPY. Target was hit. 63.05. And, maybe, this trade shows a little effort to plan your trade will reward you. Here is the charts.
$NZDJPY…again 17-March-2010

NZDJPY held 63 level well, and made a good run to mid 64 level. I reviewed my analysis, and now I am keen to look at short opportunity at current level. I am going in to test the resistance zone. Let’s see. Here is the 4-hour chart
Chart of the moment: $NZDJPY 01-March-2010

I was trying to look for trading opportunity in AUDUSD chart. Instead, NZDJPY caught my eyes. We are heading to a 3rd test of 60 area. I thought all eyes are on this level. Err…is that a triangle pattern? Hmm..Not sure. But I am still interested in testing the support at 59-60 area. Let’ see. […]
Chart of the moment: $NZDJPY 11-Feb-2010

So, my Aussie positions are closed now. I am not stopping here. I am looking at potential short trade of NZDJPY. Again, this is a simple idea, I am going to test the resistance. What do you think?

