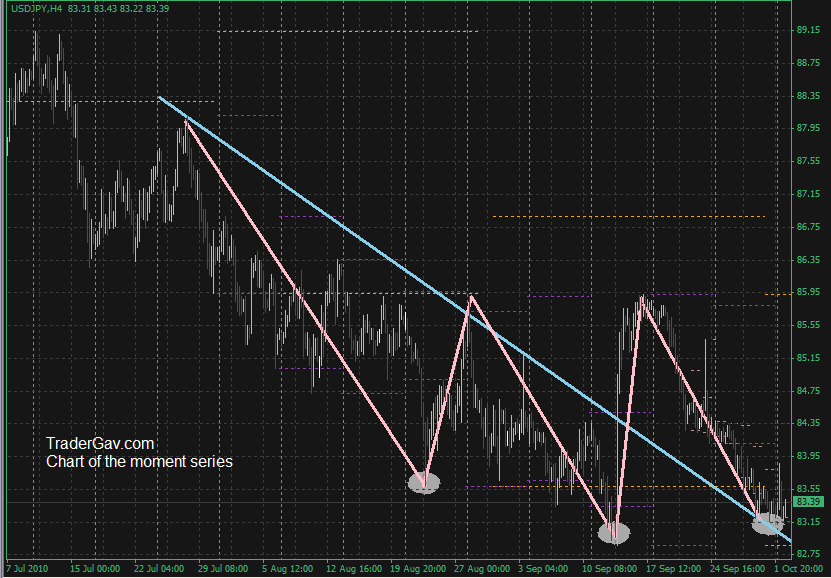
Here is the 240-min chart of USDJPY that I am looking at. Do you see the pattern here?
Here is the chart.

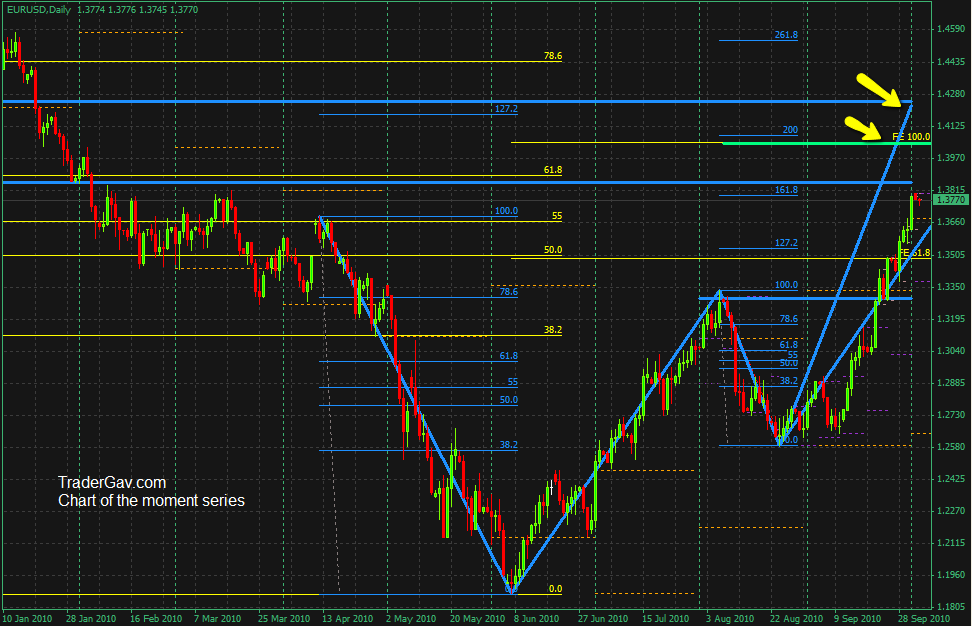
I intend to confuse you with this chart. Have a look at EURUSD daily chart. I am looking at two potential targets. First is the completion of ABCD formation at around 1.4040 level, and second will be the completion of Bearish Butterfly formation at around 1.4187. Well, in the perfect formation, ABCD should be part of Bearish Butterfly formation, let’s see.
Seeking the harmony within.
Now, let’s get confused with the CHART.
by Gav 4 Comments
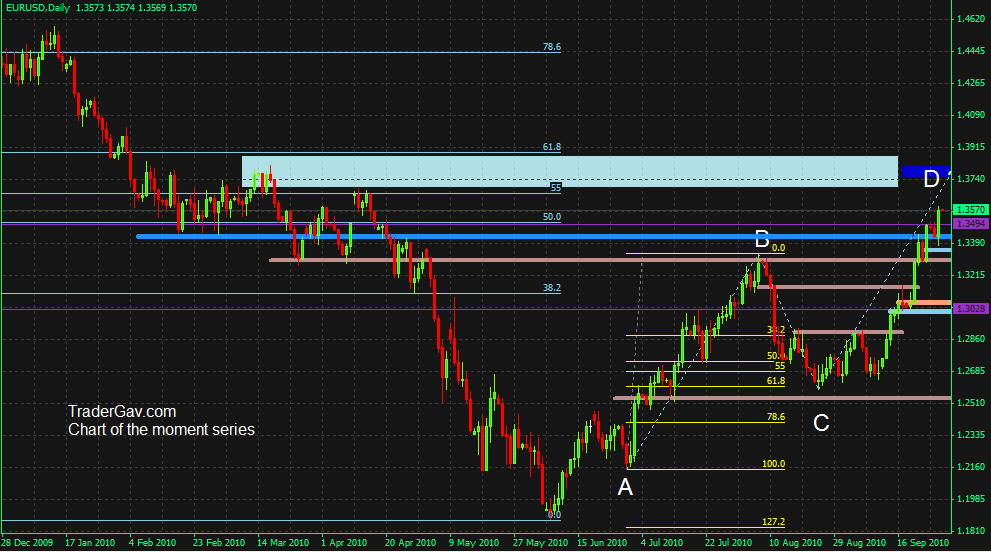
It has been a messy week so far, I just can’t see any valuable entry. Probably, I will just take the week off. Anyway, $EURUSD has been notoriously bullish lately, with now, the upside target, I am looking at potentially 1.3770 area which is also the completion of ABCD formation.
The short term market is just getting me confused, so I have been watching bigger time frame for a better, clearer picture. Oh, whatever…
Shoot me a comment if you find the ABCD formation is invalid.
Here is the CHART!
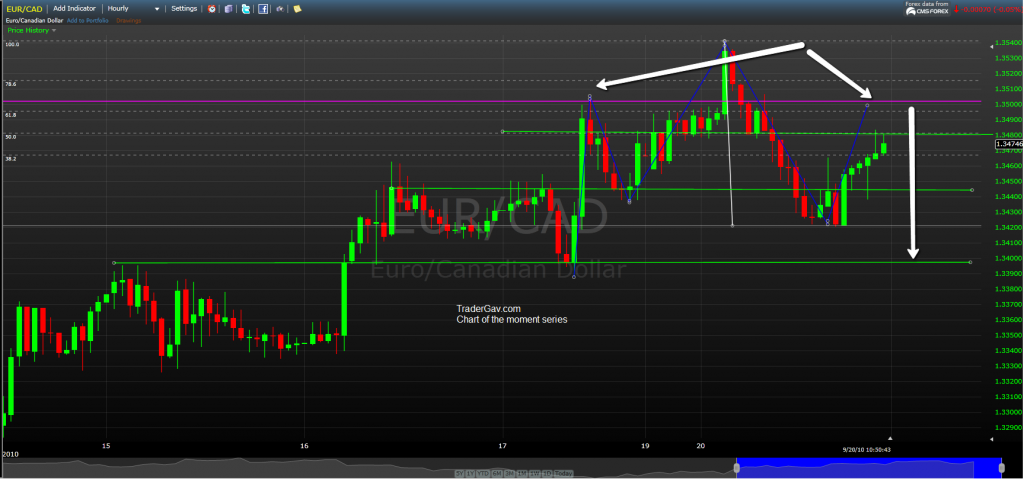
This is the trading idea that I tweeted during early Tuesday Asian morning. I am looking at short opportunity. $EURCAD failed to go through 1.35, which is also previous week’s high. It appears to me that price is struggling around this area. Well, let’s see. You know, I can be very wrong, sometimes. :-). Anyway, should EURCAD start to fall, I am looking at 1.34 level as first target.
Here is the CHART!
by Gav
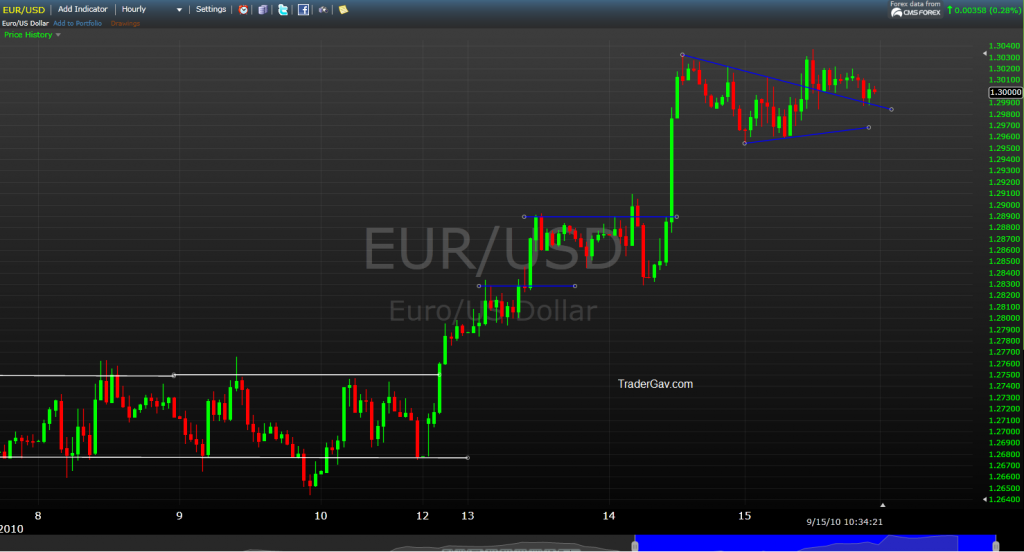
I was thinking about shorting EURUSD yesterday at 1.3 level, and in fact, I did. I closed the position with some small gain. Had another look at EURUSD, We have a pennant formed at the top, broke out, and now we are back to the back of the trend line. Now it got me interested in short term long of EURUSD. I am still thinking. Well, this is another idea.
Anyway, I am looking at near 1.31 area as next resistance level.
Here is the Chart!