
I have been looking at this chart since last Friday. Starting from 0.8540 will trigger my short. However, there’s also a possibility of running into 86 level where another bearish harmonic setup is formed. In short, currently, I am looking at the zone that contains confluence of bearish harmonic pattern, Fib levels and price resistance […]
ABCD
$AUDCAD 19 Jan 2011

Slow start for the week. I did not find too many interesting setups at the early of the week. Anyway, who is looking at $AUDCAD? I thought we have some interesting bearish harmonic setups here. I am looking at short opportunity here. It is not too difficult to see the confluence of fib levels, Channel […]
GOLD $GLD 02 Dec 2010
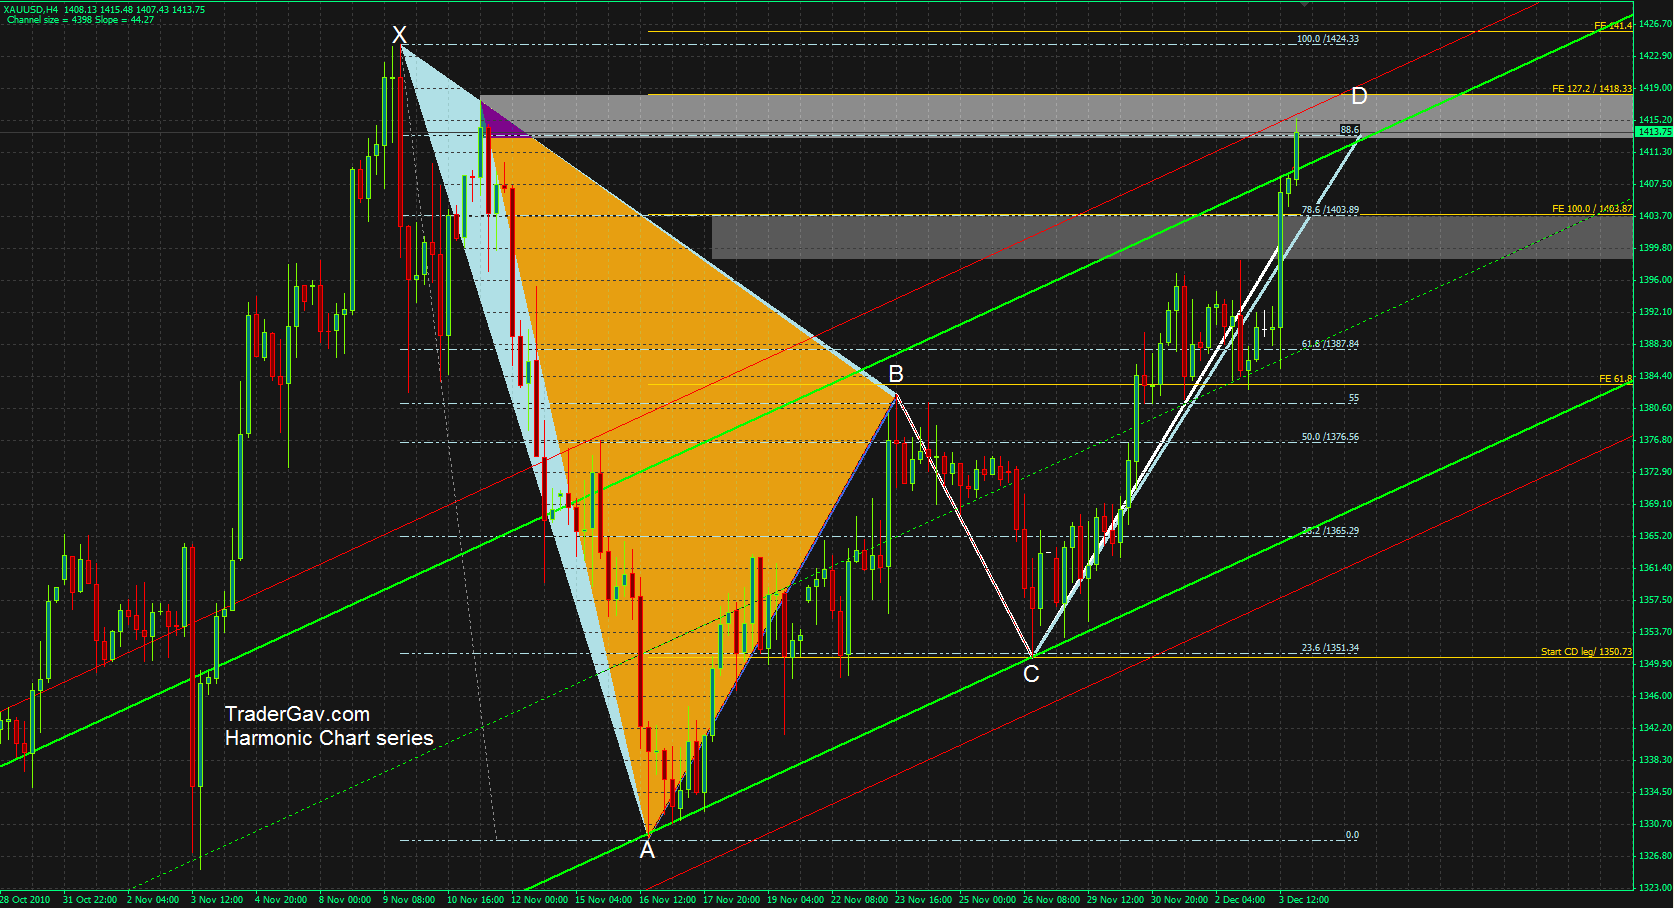
Here is the GOLD chart that I am looking at. I see confluence of resistance level, channel, Fib levels, and harmonic formation. I am keen to watch 1400 before deciding if to go short. [tab: Initial Setup] Here is the chart…… to confuse you. [tab: Update 05 December 2010] The initial bearish harmonic setup was […]
$USDJPY 10 Nov 2010

Here is the USDJPY chart. I am looking at 83 area for potential short trade. There are confluences of Fib extensions, harmonic patterns formation, and price resistance area. Here is the chart to confuse you.
$GLD GOLD 08 Nov 2010
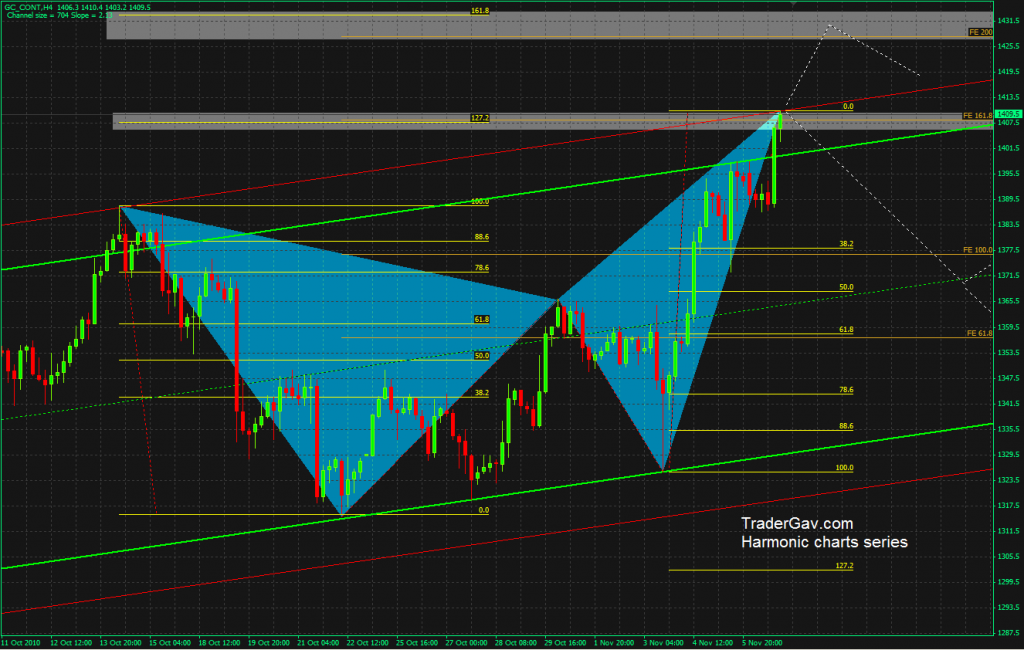
I am looking at GOLD chart this morning, I got the feeling it might be the time to see some corrections soon. It is now trading around the top of the recent channel, and there are confluences of Fib extensions and harmonic patterns. I have two potential zones defined on my chart. Let’s see how […]
$GBPCHF 08 Nov 2010
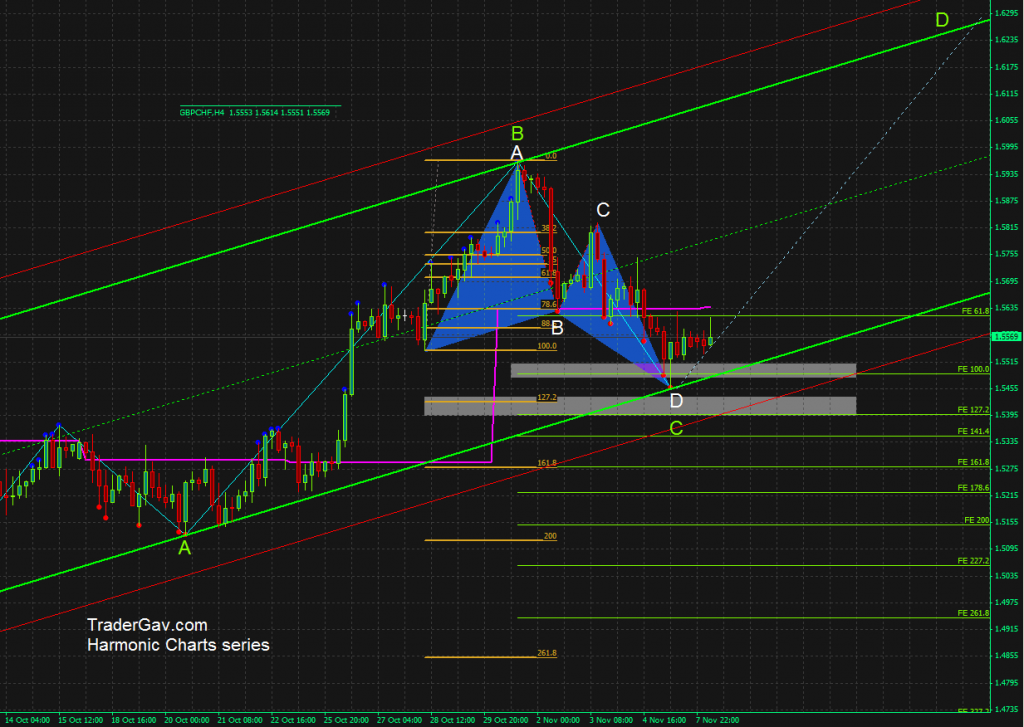
Here is an interesting chart. GBPCHF bounced off the lower channel band, with confluences of Fib extensions and harmonic patterns. I am interested in trading the Long side. OK, I am going to confuse you with this chart. Go figure.

