Here are some charts with levels I am watching for the coming week. $AUDUSD $NZDUSD $EURUSD $GBPUSD $USDCHF $EURAUD $EURCAD Have a great week ahead!
Support Resistance
Weekend Charting 06 May 2012
Here are the charts with some ‘annoying lines’ that I am watching for the coming week. Hope they annoy you as well. $AUDUSD Hourly $AUDJPY 240min $EURUSD 240min $EURAUD 240min $EURJPY Hourly $GBPUSD 240min $NZDUSD 240min $USDJPY 240min $USDSGD 240min $USDCHF 240min $USDCAD 240min Good trading!
Weekend Charting 28 April 2012
Here are a couple of charts in my watch list. I am looking at the levels for next week’s trading. I don’t find a lot with clean levels now. So patience is required at the beginning of the week. Anyway, here are the CHARTS. $GBPAUD — This is probably the cleanest chart I can find […]
$BUND 10 Feb 2012
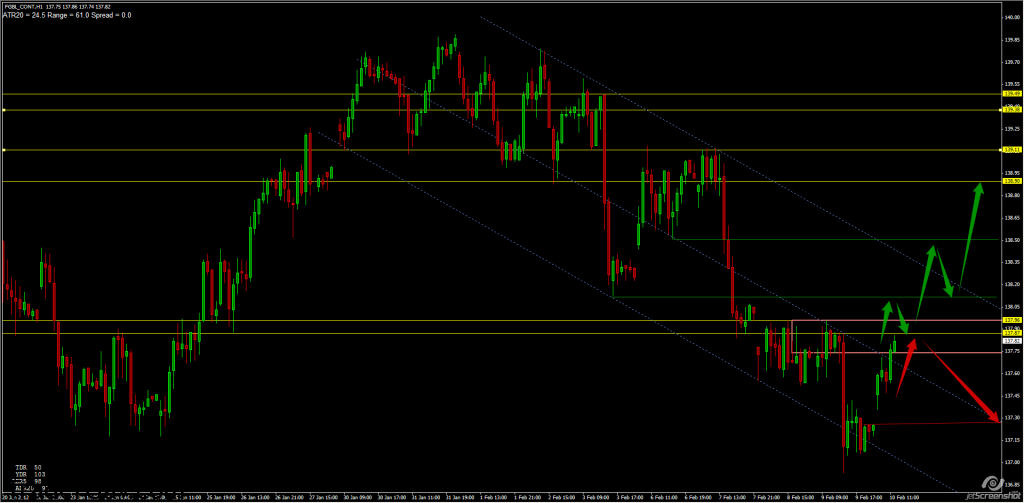
[tab:Setup] BUND is not the market that I am familiar with. I was just looking at the hourly chart, I thought it shows some interesting technical levels here. Here is the …. CHART [tab:Update 10 Feb 2012] I like the movement of BUND, whichwas almost technically prefect. I mean, it reacted well at the levels. […]
$AUDUSD 10 Feb 2012
Just a quick note and chart about $AUDUSD. For short term trading, potentially, I am interested in going short if the level around 1.0685/1.0670 is broken. Let’s see how it goes. Here is the …..CHART!!
$GBPUSD 07 February 2012
[tab:Setup] I was scalping some shorts at the end of U.S session, and decided to scrapped the trade with over 10 pips profit. It looks to me, cable might be preparing for another up leg. Well, it might be too early to make the call, I would prefer to stay away from any shorting idea […]


