
Here is the potential symmetrical movement I am watching while AUDJPY approaching 82.50/80 resistance zone. �Of course, market is never perfect, let’s see how this plan works out.
Harmonic setups
$AUDNZD 01 Mar 2012
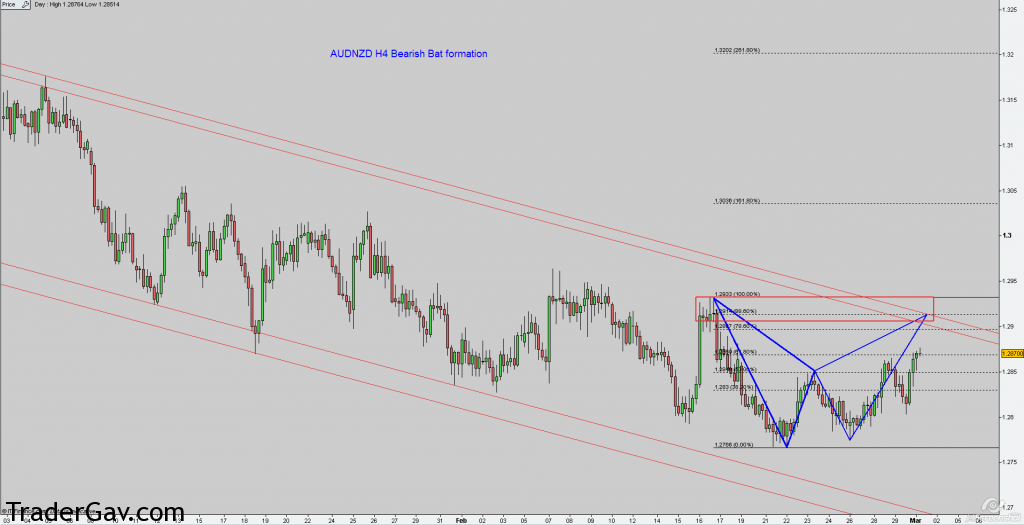
Here is a potential completion of harmonic pattern in $AUDNZD. I am looking at 1.29 for potential short setup. This is a trend continuation pattern, and I am looking at the resumption of existing downtrend. Here is the …. CHART!!
$USDSGD 21 Oct 2011

I don’t expect too much movement in the Friday afternoon (London session). So I will keep the chart for Monday to see if I still have good entry spot. $USDSGD is setting up a potential short opportunity at the current level. I wish I could write a thousand-word blog post to explain the setup to […]
$AUDSGD 21 Oct 2011

Focus! Switch off your lousy music collection, and concerntrate on the chart. :LOL Well, $AUDSGD, one of my favourite pair to watch. I see the completion of ABCD formation at the top of channel, and a little ribbon pattern forming while retesting the back of trend line. Have a look at the chart, it is […]
$AUDNZD 19 Oct 2011
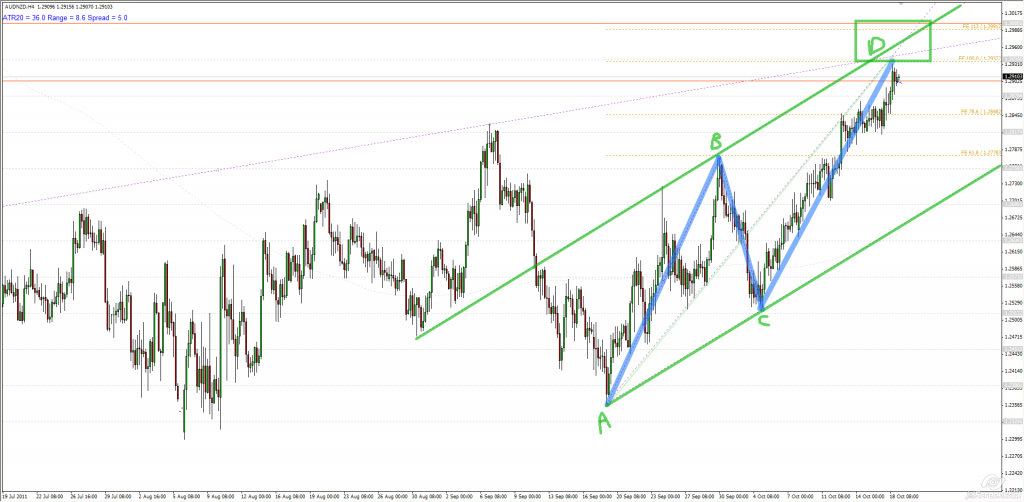
$AUDNZD is approaching resistance level with confluence of harmonic pattern and trend line retest. The risk is the pair might test 1.3 before any significant correction. Let’s see how it works out. Here is the …. CHART!
$EURUSD 13 Oct 2011

I have been stalking a short of EURUSD. (Well, who doesn’t?). However, I prefer to see price pushing a little further before establishing short. Let’s see. As the chart shows, we have confluence of channel, hamornic pattern. And if you notice, it is retesting the previous trend lines. OK, here is the….. CHART!!!!

