
I had a quick look at AUDJPY. Here is what I see, and I love this chart. Are we, again, heading for another breakdown? What do you think? Here is the … CHART! (click to view full chart) Some technical statistics About this tool
Chart of the moment
Chart of the moment $EURGBP 06-Nov-2009

I am looking at 240 min chart of EURGBP. Are we heading for another breakdown? I am watching closely, and maybe, we are looking at 0.87-ish. What do you think? Some technical statistics: About this tool
Chart of the moment $GBPUSD 27-Oct-2009
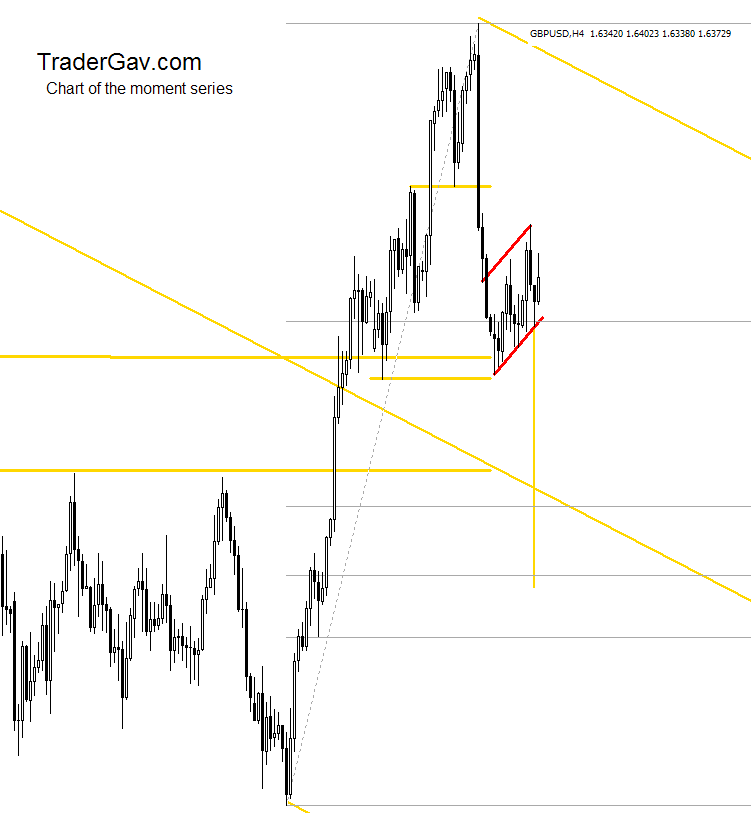
To me, the Cable buying during last session did not change the trend. Instead, I thought there might another opportunity for SHORTs? This is a text book pattern. Nothing fancy, let’s see how it works out. If the the breakout of the pattern realized, I am revising the downside target to around 1.6-ish, still in […]
Chart of the moment $AUDJPY 23-Oct-2009
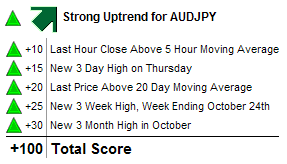
Below are daily chart and hourly chart of AUDJPY. This pair was not in my radar, and thanks to the tweet from BladeTrading. In hourly chart, we have a rising wedge forming, and a 61.8 retracement in daily. So, what do you think? Some technical statistics About this tool
Chart of the moment $EURJPY 23-Oct-2009
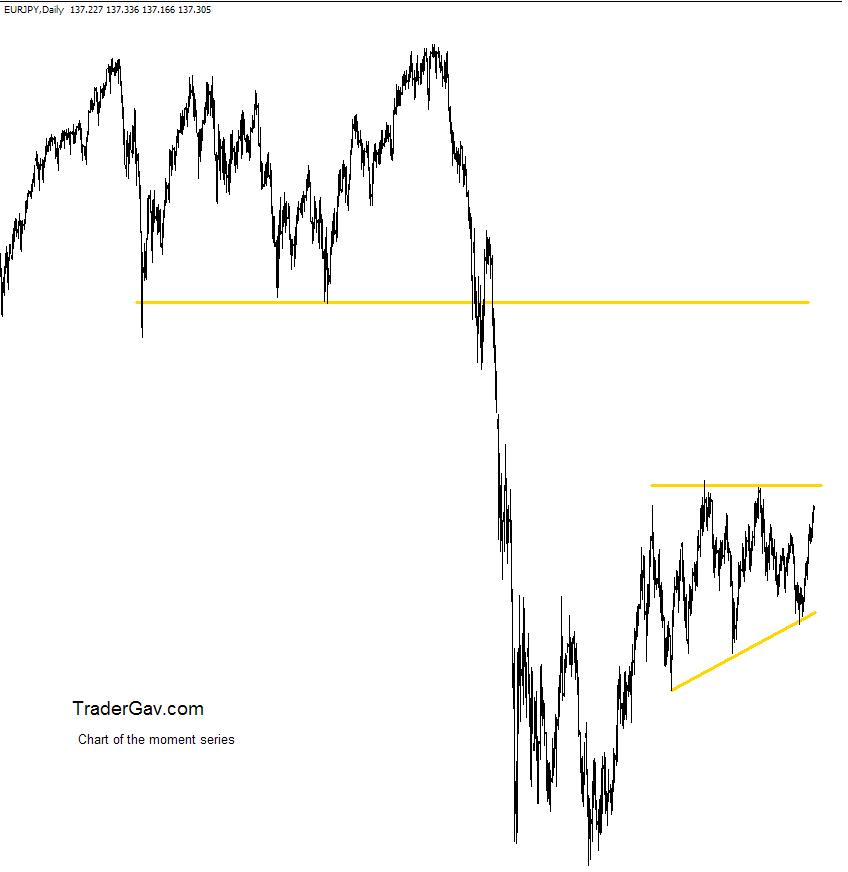
This is daily chart of EURJPY. Well, you can say we are heading to a mountain of resistance, or maybe we again, prepare for a breakout? Interesting to follow this development. What do you think? Here is the…. CHART! Some technical statistics :
Update Chart of the moment $GBPJPY 21-Oct-2009

Over the past 2 trading days, there are some interesting developments in GBPJPY. It seems to be holding well at resistance level, and who knows, it might be ready to break away from it. This is what I see now. What do you think? (click the image to view chart)

