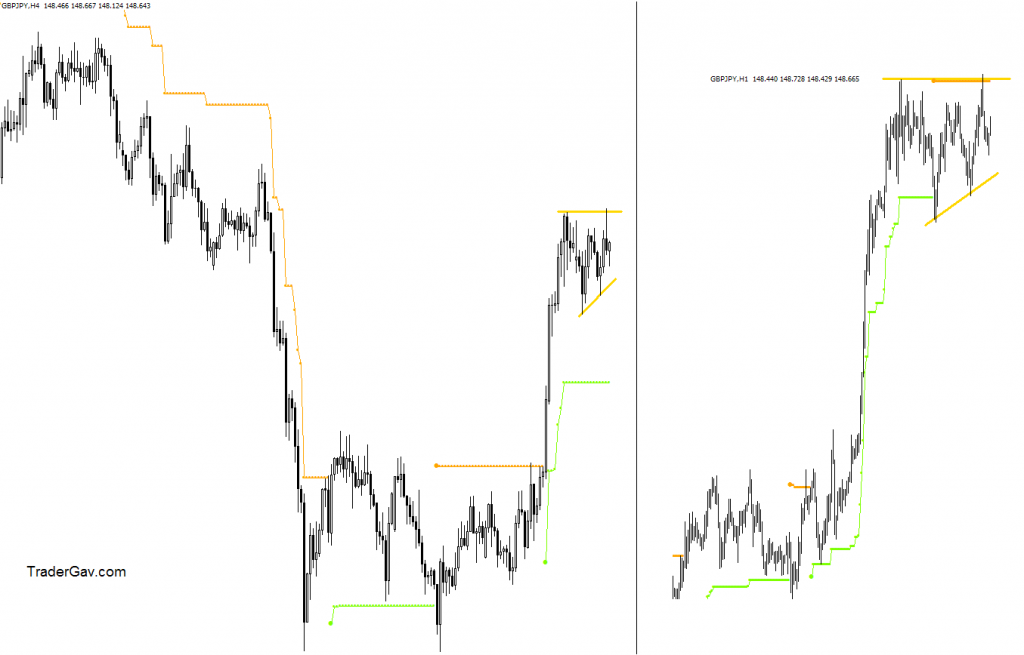
Over the past 2 trading days, there are some interesting developments in GBPJPY. It seems to be holding well at resistance level, and who knows, it might be ready to break away from it. This is what I see now. What do you think? (click the image to view chart)


looks to me like it’s in the making of wave 5 here, with the current triangle(flag) as a wave 4 correction.
Uhmm..so we are looking at the last leg of wave 5 here before any major correction?
looks to me like it’s in the making of wave 5 here, with the current triangle(flag) as a wave 4 correction.
Uhmm..so we are looking at the last leg of wave 5 here before any major correction?
Oh that’s just my personal point of view 🙂
I’m still quite new to this EW thingie, but, that’s pretty much what i have in mind.
What do you think?
Oh that’s just my personal point of view 🙂
I’m still quite new to this EW thingie, but, that’s pretty much what i have in mind.
What do you think?
hmmm …..
Looking at the $XBP index chart, (http://stockcharts.com/h-sc/ui?s=$XBP&p=D&yr=0&mn=11&dy=0&id=p99554314714) seems like it has just completed it’s a-b-c correction and is about to make a new wave up (though it’s currently sitting right at the down sloping resistance)
but, that really looks like a Head & Shoulder pattern there, and it’s neckline broken in mid september around $162. And the current price is retesting the neckline.
Hmmm ….. must be pretty confusing for the bears and bulls alike
;p