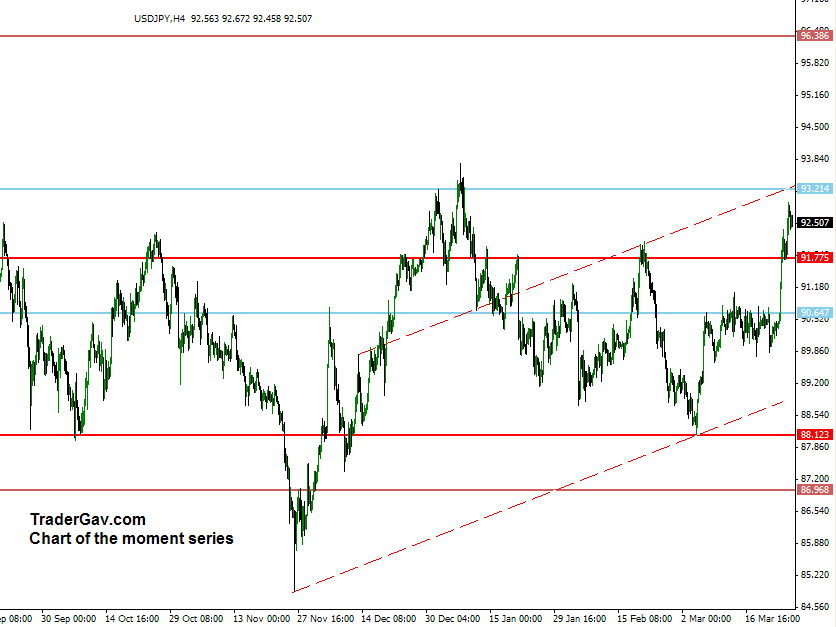
I have been watching USDJPY. For short term trading purposes, I am looking at potential short opportunity above 93 cents. Of course, it might start to retrace before 93….Anyway, I am looking at another leg to move up to 93 now.
Chart of the moment
A follow up of $NZDJPY

I don’t normally post detailed result of my trades. I just thought this chart is a beauty. Referring to the previous post for the short setup of NZDJPY. Target was hit. 63.05. And, maybe, this trade shows a little effort to plan your trade will reward you. Here is the charts.
$NZDJPY…again 17-March-2010
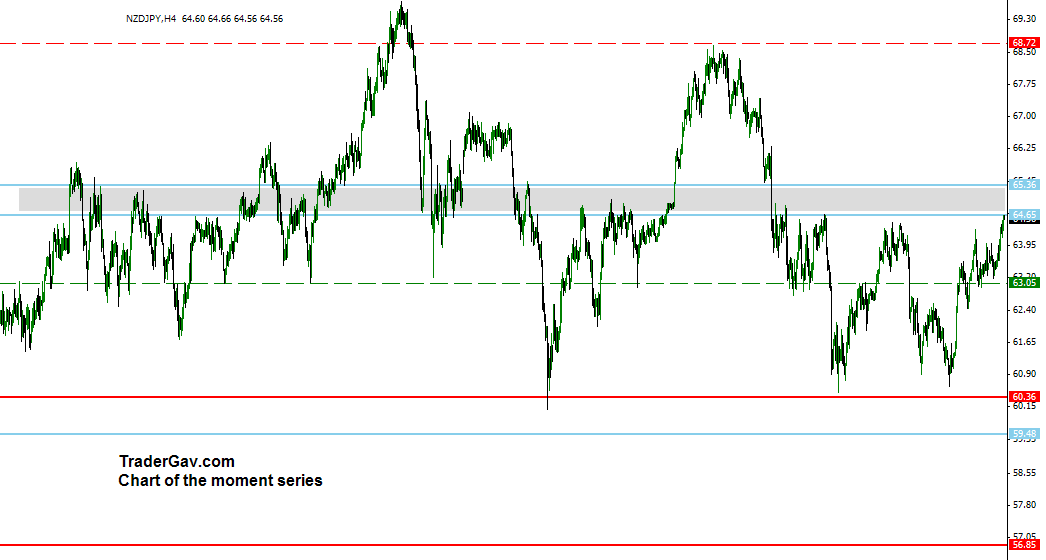
NZDJPY held 63 level well, and made a good run to mid 64 level. I reviewed my analysis, and now I am keen to look at short opportunity at current level. I am going in to test the resistance zone. Let’s see. Here is the 4-hour chart
Chart of the moment: $NZDJPY 01-March-2010

I was trying to look for trading opportunity in AUDUSD chart. Instead, NZDJPY caught my eyes. We are heading to a 3rd test of 60 area. I thought all eyes are on this level. Err…is that a triangle pattern? Hmm..Not sure. But I am still interested in testing the support at 59-60 area. Let’ see. […]
A $AUDNZD trade
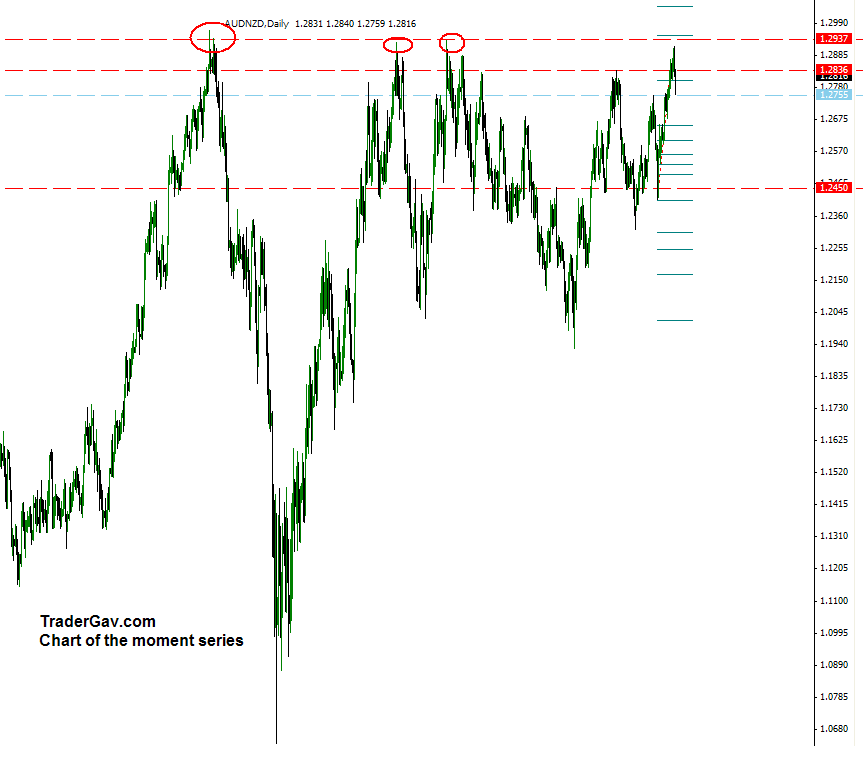
I received a couple of tweets asking about AUDNZD. The question is summarized : Is it UP or Down? or Bullish or Bearish? As usual, I don’t answer this type of question. If you have been trading for sometime, you know why I do not answer these questions. Have a look at AUDNZD daily chart, […]
$USDCAD,I am not so sure about..
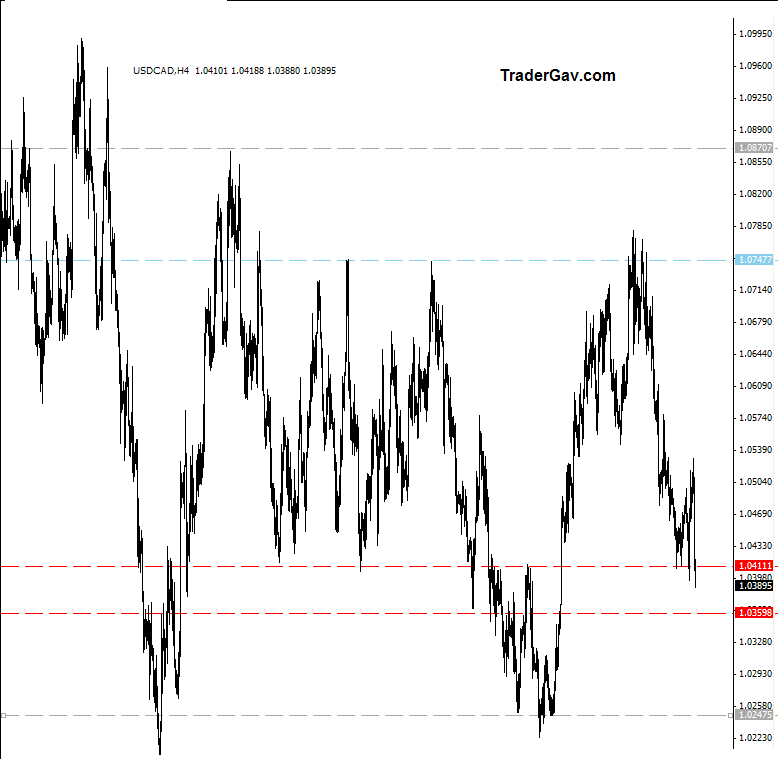
I have been trading the whole week, and still holding half position of EURGBP long. I just did not find time to write anything here. There are just too many things to think and handle outside my trading life recently. A little bit stress is building up… Anyway, that’s not the point of this post. […]

