
Very often, on twitter or forums, I see people posting some simple trading setups, and give them some odd names, then call it their inventions. Laughable indeed. Anyway, kudos to them for providing some amusements. One of the most commonly seen setup is Immediate retest of broken support/resistance level. Well, regardless of the names given […]
blogs
Managing your trade :Exit strategy
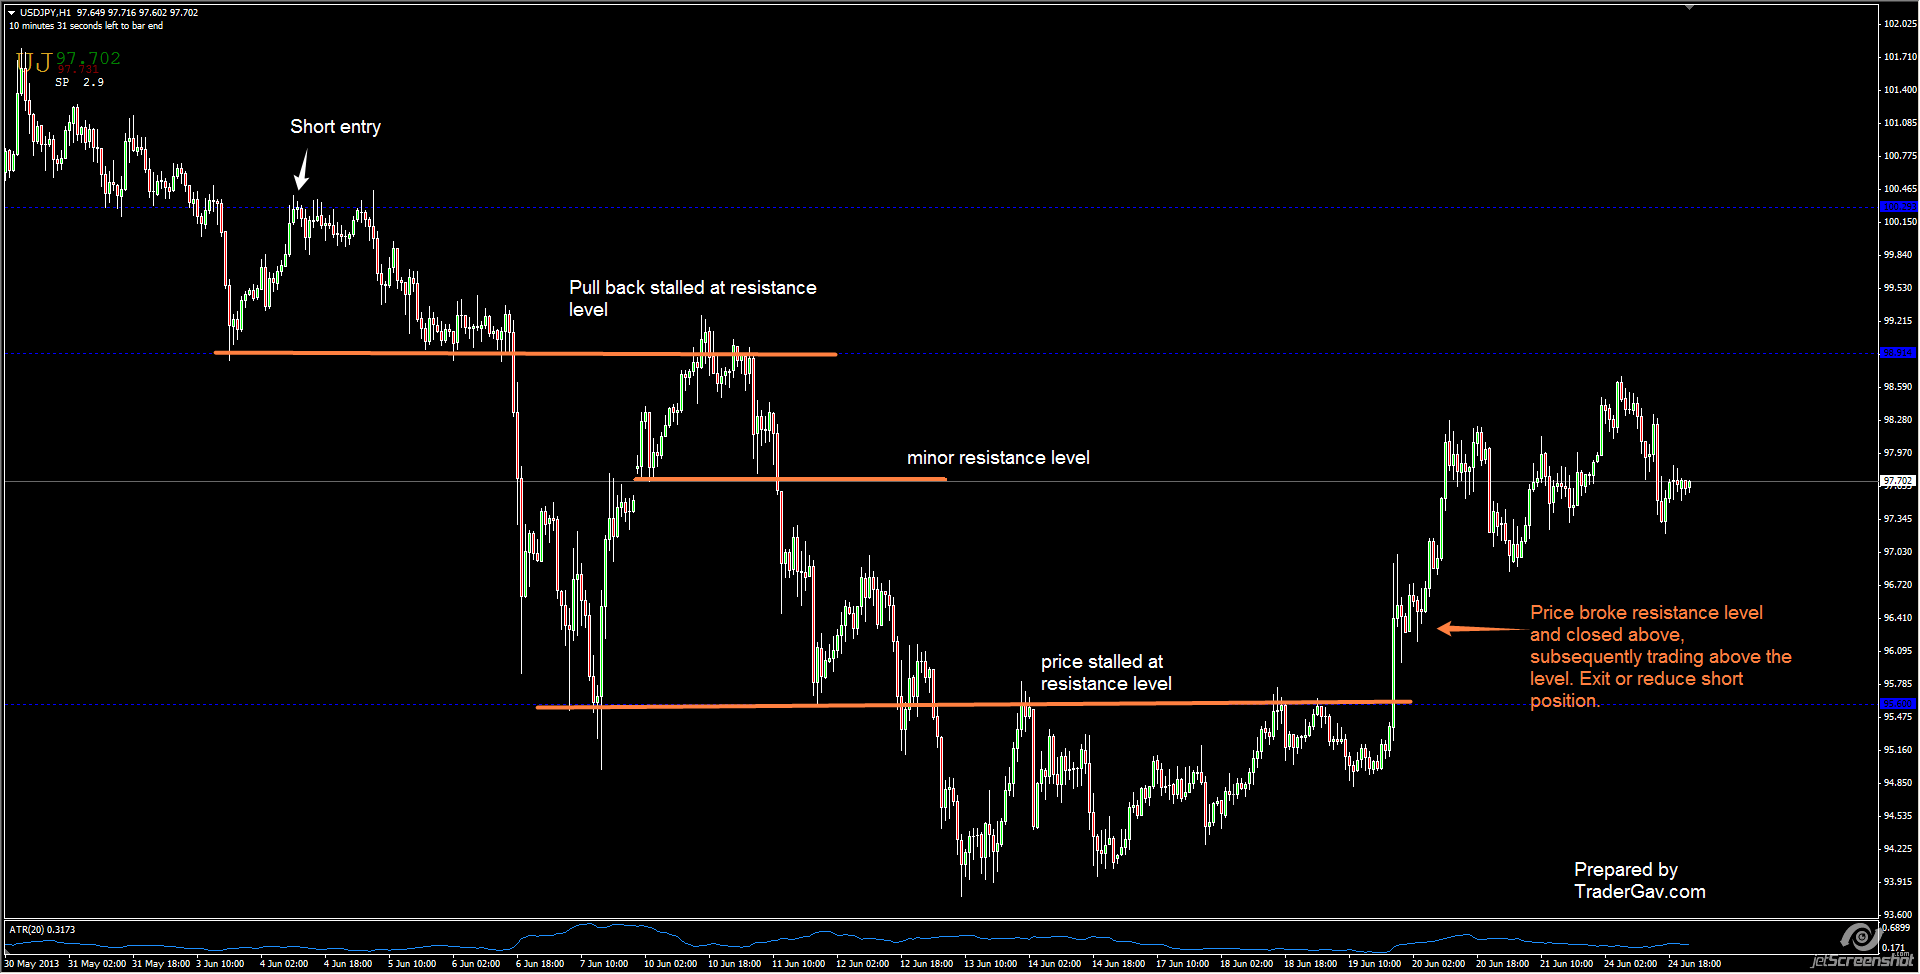
I am not the inventor of this strategy. It is widely available on the internet, and I have no idea who was the originator. I have found it to be effective when using simple support/resistance methodology to manage trades. The Simple Exit Strategy This is an exit strategy using a 5-min chart, however, it […]
TED talk: Your body language shapes who you are
I thought this TED talk is definitely worth watching. My weekend 21 minutes well-spent. “Body language affects how others see us, but it may also change how we see ourselves. Social psychologist Amy Cuddy shows how “power posing” — standing in a posture of confidence, even when we don’t feel confident — can affect testosterone […]
Coffee Thoughts 02 November 2012

Capital preservation is important. Risk management is important. But the trader’s job is to risk and make money, not sitting in the office to preserve capital. When it is time to trade, just trade. Capital is a tool for you to use to make more money, not for you to preserve. If you want to […]
Coffee Thoughts 31 Oct 2012
Looking out the window, you see it is raining. Put your hand out of the window, you know it is raining. And yet, you still feel the need to view the website or call Bureau of Meteorology to confirm if it is really raining. Some traders trade in this way. Is the the […]
A gap trade example 18 June 2012 : $AUDJPY
I have stopped posting my trade long time ago for various reasons. Anyway, I thought I might throw in an example today to show how I trade gap. In fact, I am not really sure if �I can call this a gap fill strategy, as it is basically a simple support/resistance trade. After all, everything […]

