Sell order was executed at 285.6 immediately after market reopen for afternoon session. However, selling force was not strong. It was hanging in the air with small flunctuation. U.S futures are in negative territory now. Watch out for Nikkei futures reopen at 330pm.
Blog and Rants
SIMSCI 05-June-2006: Potential Short
With negative biased sentiment. I am looking for price setup for possible short sell opportunity for intraday SIMSCI. Market seems to be very quiet at this point of time.
SIMSCI view ended 02-June-2006
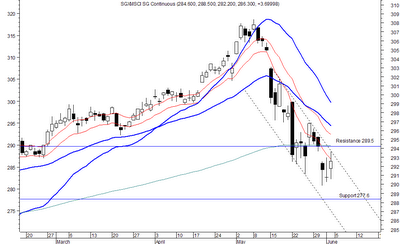
It does not look better even after last Friday’s rebound. SIMSCI futures is current stucked between support and resistance level. Immediate resistance level 289.5 while immediate support appears to be at 277.6 A downtrend channel is well formed. An analysis on SIMSCI futures can also be found at Traderswin Futures Trading Blog.
Trend analysis : STI & UOB Sesdaq
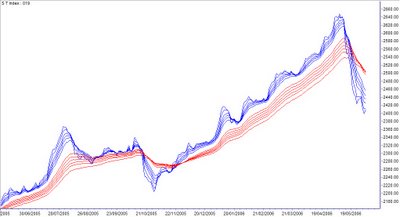
STI To evaluate market condition , I am always examining trend characteristics. Short term group moving averages continue drifting downward and stay below long term moving averages. There was a minimal rebound at the end of last week, however, it is still below trigger line. Directional analysis wise, downtrend strength is staying flat, while negative […]
Week end 02-June-2006: After thought
It has been a week that I did not post any article about stocks trading. In fact, current singapore stocks market does not excite me much. I position myself as a swing trader for stocks and day trader for SIMSCI futures. Currently, I can’t find any good setup for stocks. And sentiment is not encouraging […]
RE: SIMSCI 02-June-2006: Potential short: LongTrade Closed
[photopress:SIMSci_12_min_full.PNG,full,pp_image] This is 12-min chart of SIMSCI. It is indeed a good day. After Short setup failed to form, I observed a Long opportunity. Long position was established at 284.6. Initial target was 287. To be frank, I thought the target was too far away. I was obviously wrong. Target was exceeded. Trade was closed […]

