STI

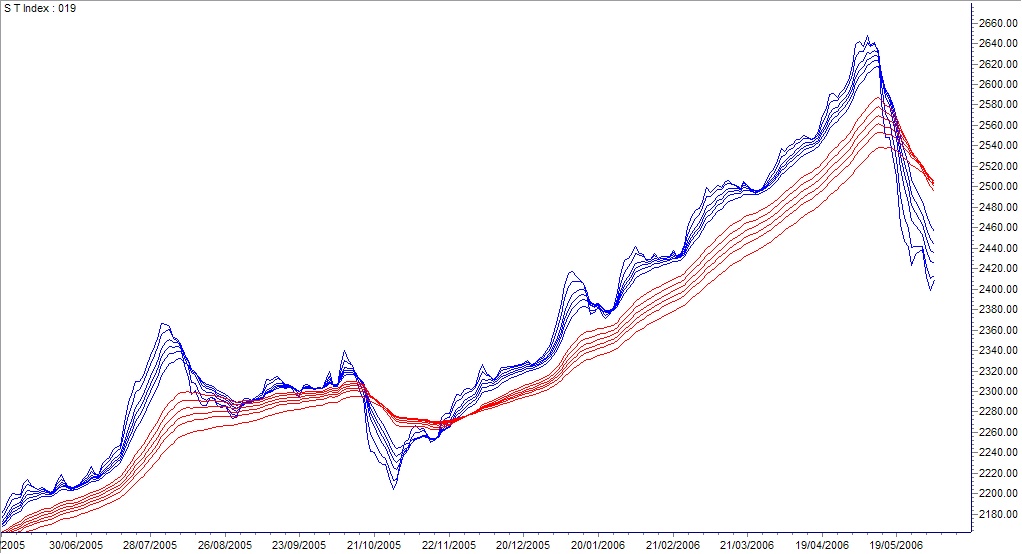
To evaluate market condition , I am always examining trend characteristics. Short term group moving averages continue drifting downward and stay below long term moving averages. There was a minimal rebound at the end of last week, however, it is still below trigger line. Directional analysis wise, downtrend strength is staying flat, while negative index is still dominating. There was a rebound at the end of last week, however, it was weak and staying below trigger line. The last note, STI is still trading below 150-day moving average. No positive sign is observed at this point of time.
UOB Sesdaq

It is rather similar to STI. I do not see positive sign of Sesdaq trend yet. Short term moving averages still staying below long term moving averages, though there seemed to be a rebound, it is still below trigger line. Directional index is showing negative value and moving below trigger line. These observations discount any rebound appeard last week. No sign of recovery at this point of time.


Leave a Reply