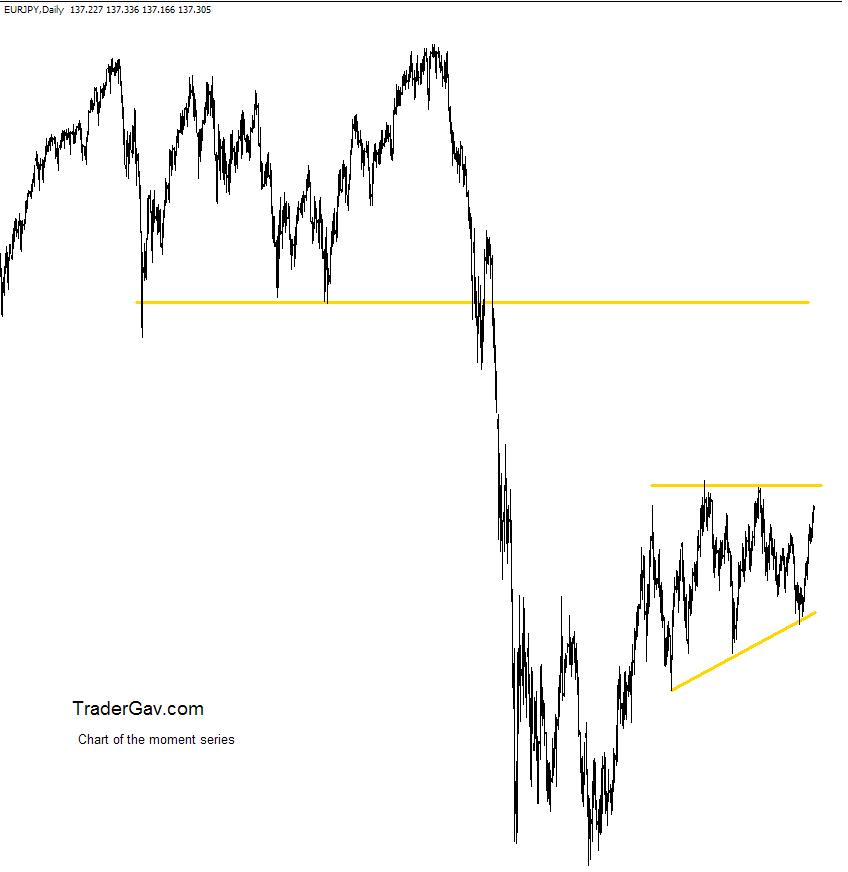
This is daily chart of EURJPY. Well, you can say we are heading to a mountain of resistance, or maybe we again, prepare for a breakout? Interesting to follow this development. What do you think? Here is the…. CHART! Some technical statistics :
Update Chart of the moment $GBPJPY 21-Oct-2009

Over the past 2 trading days, there are some interesting developments in GBPJPY. It seems to be holding well at resistance level, and who knows, it might be ready to break away from it. This is what I see now. What do you think? (click the image to view chart)
Chart of the moment $GBPJPY 18-Oct-2009

Oi! Enough? Are you done? That’s what I see from the chart of GBPJPY. In fact, this pair was not in my radar. Thanks to the tweet from Casey Stubbs. So, what do you think now? Here are some technical statistic: About this tool
Worth noting
Joe Ross posted a link on twitter with title ‘A simple Idea to improve your trading’. I thought it is a good reminder to all my readers here. And I certainly agree with the quote below, and being disciplined in trading methodology execution was and is the key of my consistency. I feel certain that […]
Chart of the moment $GBPUSD 09-Oct-2009
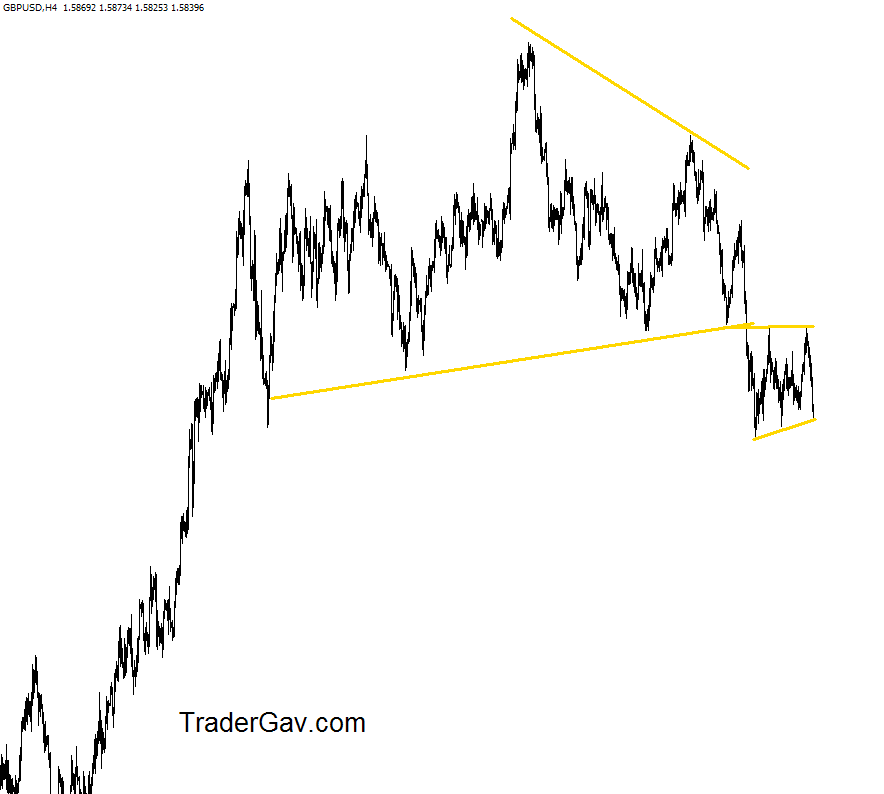
This is 240 min chart of GBPUSD. I have no position at the moment, but I am a little bit bearish. Is it going to break down further? What do you think? Here are some technical statistics: About this tool
Challenge ahead
It had been two tough and dark weeks for me. But, I reckon the worst is over. If you follow me on twitter, you’ll know what I am talking about. There’s nothing worse than looking at your loved ones falling sick, lying on the bed. Well… I don’t want to repeat and recall that. Let’s […]

