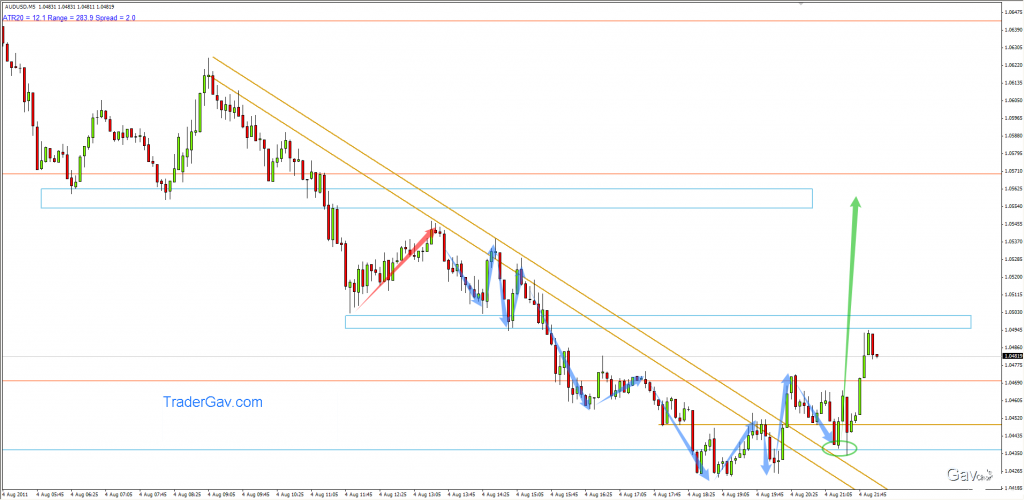
I am watching AUDUSD during Asian session. I thought we might have some interesting setups forming soon. Let’s see. Here is the….CHART!
$AUDUSD 05 August 2011
Went long of $AUDUSD this morning (Australian time). Trying to bank some panic money from the market. I saw AUDUSD stalled around mid 1.04 area, and it shows a pretty clear technical setup to me. As I tweeted earlier on, I had banked half of the position,and leaving the remaining to run. That’s pretty much […]
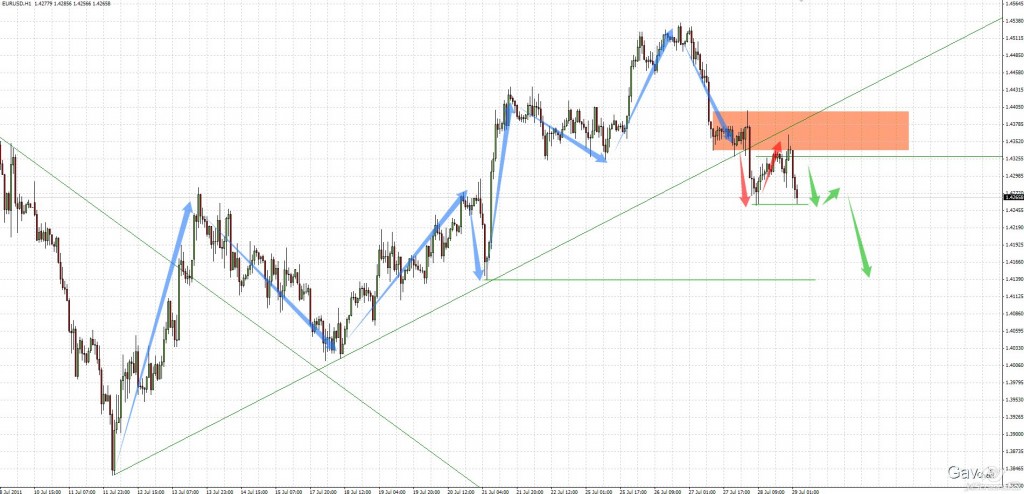
$EURUSD 29 Jul 2011
Here is the short term position I am holding. $EURUSD broke the recent uptrend line, and now previous support turns into resistance. 1st profit target is achieved, position is now risk free, let’s see where the market is going to bring us.
This infographic was prepared by Oanda. I thought it is very clear and easy to understand. Created by OANDA The Greek Tragedy: Greece’s Economic Crisis, used with permission of OANDA
$EURGBP 22 June 2011
Trade completed. Click on tabs for setup and update. [tab: Setup] Here is the potential swing setup I mentioned in my tweet. $EURGBP is moving symmetrically into resistance level. I am watching closely. Pretty straightforward setup, I don’t think I need to write too much here. Here is the… CHART! [tab: Update 28 June 2011] […]
$GBPJPY 20 June 2011
Though it might be too early to call for this setup, I thought the chart might give my 12 readers some useful ideas. Anyway, this is assuming GBPJPY hold well around 128.35. I will negate this analysis if the level is broken. I see two potential short opportunities. Here is the ….. CHART!


