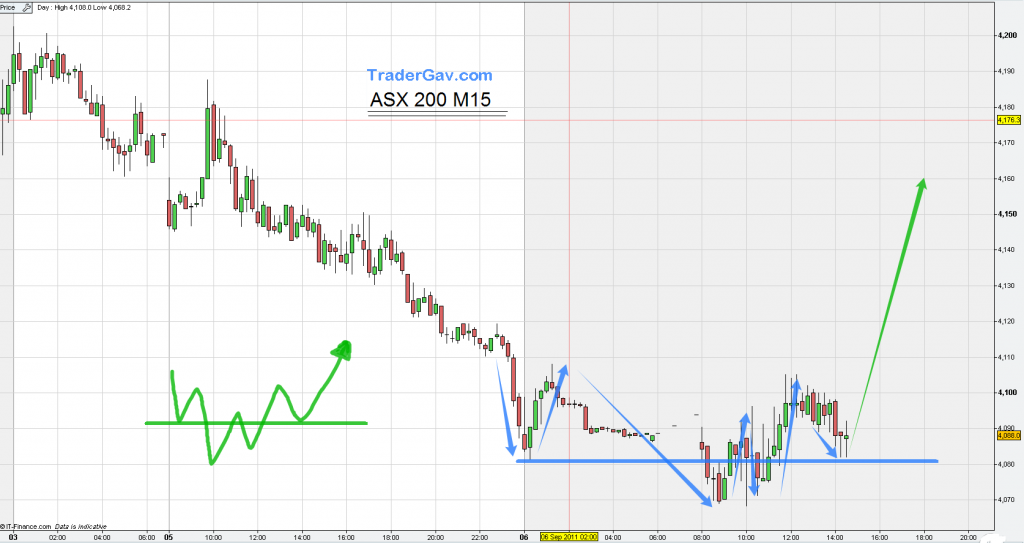
[tab:Setup] After RBA’s decision to leave cash rate on hold at 4.75%, I see an interesting setup in ASX200. This is an intraday trade setup. I am testing the idea with small risk. As long as the last low holds well, long bias remains. Let’s see how it works out. Here is the …. CHART! […]
$NZDUSD 31 August 2011
A bearish harmonic setup is observed while NZDUSD is retesting the broken trend line. Bias remains short for now.
New page: Intraday views
In case you haven’t noticed, I started a new page named “Intraday view“. Nothing fancy, basically, I am posting charts mentioned in my tweets which I found to be interesting throughout the day. No detailed comment will be given, just charts. I figured these charts might help some of my 13 readers, or at least, […]
$AUDNZD 19 August 2011
Here is another potential swing trade setup I have been looking at. $AUDNZD is testing the established down trend line, and with completion of bearish ABCD formation. I expect price to face resistance at this level. I’ll be watching price action closely next week to confirm my thought. Here is the….CHART!
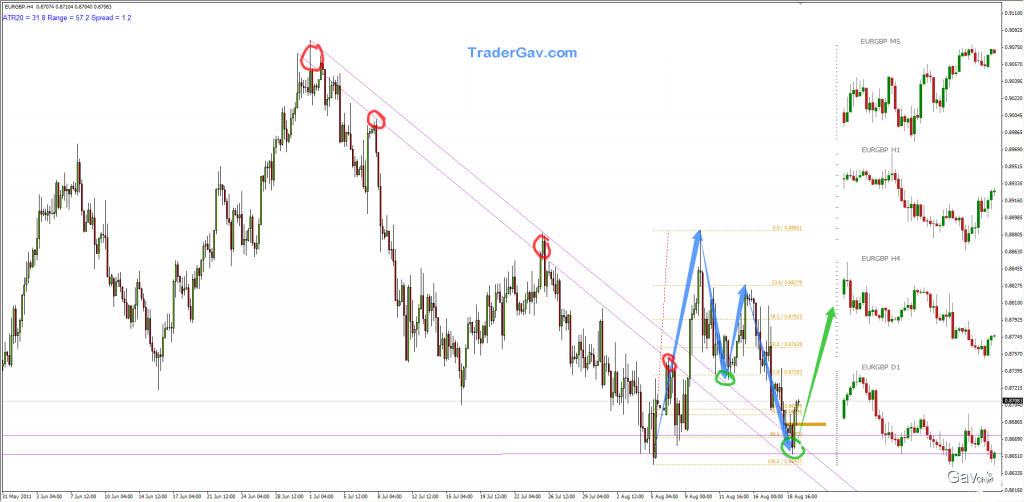
$EURGBP 19 August 2011
EURGBP pulls back to the previously broken down trend line, and also complete a bullish harmonic formation. This presents a potential long opportunity with first target around 0.8880. Here is the…..CHART!
$NZDUSD 17 August 2011
I maintain my short bias of $NZDUSD for now after the established uptrend line was broken earlier this month. The broken trend line was retested and acted as resistance. I have been making some daytrades for the past couple of days. However, for the bigger picture, I am now looking at a potential swing trade, […]


