• Skip to primary navigation
  • Skip to main content
  • Skip to primary sidebar
  • Skip to footer

TraderGav.com

Gav's trading blog - Perseverance, Consistency, Confidence

  • Home
  • Start Here
    • Back to Basics of Trading
    • Resource For Traders – The Best Tools for Traders
    • Learn Trading Articles
    • Sierra Chart Resource
  • Blog
    • Blog Posts
    • Other learning resource
    • Dummy Collection
    • Harmonic setups
  • About Me

Archives for June 2006

SIMSCI 06-June-2006 : Ambiguous situation

by Gav Leave a Comment

It is very interesting to see SIMSCI opened low and moved higher in the first 45 minutes. It looks slightly positive. The drop was obviously contributed by reddish overnight DJ. It is an ambiguous situation now. SIMSCI refused to deep further. I would consider a long position or staying aside (no trade). There is a positve movement in SIMSCI, however, under performed HangSeng and Nikkei hold me down from establishing a Long position. I do not like to see -200 point loss in HangSeng and Nikkei yet, I am Long SIMSCI. I would prefer to observe further.

Filed Under: Rant Tagged With: SIMSCI

RE: SIMSCI 05-June-2006 : Potential Short: Trade closed

by Gav Leave a Comment

[photopress:simsci_12_min_full_day.jpg,full,pp_image]
Trailing stop was moved to break even point when low of 284.6 is achieved. I was tempted to take profit, however, I decided to have a perfect execution of my plan without any emotional factor. Holding on the position with nearly 0 risk involved. I would admit that, it is tough to resist temptation of profit taking. However, treat this as a challege, to resist temptation is fun. This is part of enjoyment when trading the market. I enjoy the fun of market challege. By 350pm, my position is in-the-money. I have moved my trailing stop to 285.2.

Trade was closed at 355pm with exit at 285 after seeing a positive divergence of RSI in 9-min chart and a trend line break of RSI oversold zone in 12-min chart. Again, I might be missing bigger profit, in fact I was missing out bigger profit in this trade! However, the objective here is to capture the movement caused by market sentiment and profit from it. That is my trading. Gain +0.6. Tiny but sweet.

I have put myself into the challege. I have set a target of 26 points gain in SIMSCI trading at the end of this month. I hope this is not unreasonable. I am not interested in competing, this is the fun of challenging myself.

Filed Under: Rant Tagged With: SIMSCI

RE: SIMSCI 05-June-2006: Potential Short

by Gav Leave a Comment

Sell order was executed at 285.6 immediately after market reopen for afternoon session. However, selling force was not strong. It was hanging in the air with small flunctuation. U.S futures are in negative territory now. Watch out for Nikkei futures reopen at 330pm.

Filed Under: Rant Tagged With: SIMSCI

SIMSCI 05-June-2006: Potential Short

by Gav Leave a Comment

With negative biased sentiment. I am looking for price setup for possible short sell opportunity for intraday SIMSCI.
Market seems to be very quiet at this point of time.

Filed Under: Rant Tagged With: SIMSCI

SIMSCI view ended 02-June-2006

by Gav Leave a Comment

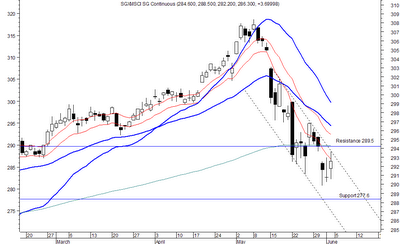
It does not look better even after last Friday’s rebound. SIMSCI futures is current stucked between support and resistance level. Immediate resistance level 289.5 while immediate support appears to be at 277.6 A downtrend channel is well formed.

An analysis on SIMSCI futures can also be found at Traderswin Futures Trading Blog.

Filed Under: Old blog archive

Trend analysis : STI & UOB Sesdaq

by Gav Leave a Comment

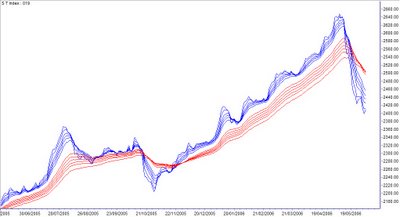
STI

To evaluate market condition , I am always examining trend characteristics. Short term group moving averages continue drifting downward and stay below long term moving averages. There was a minimal rebound at the end of last week, however, it is still below trigger line. Directional analysis wise, downtrend strength is staying flat, while negative index is still dominating. There was a rebound at the end of last week, however, it was weak and staying below trigger line. The last note, STI is still trading below 150-day moving average. No positive sign is observed at this point of time.

UOB Sesdaq

It is rather similar to STI. I do not see positive sign of Sesdaq trend yet. Short term moving averages still staying below long term moving averages, though there seemed to be a rebound, it is still below trigger line. Directional index is showing negative value and moving below trigger line. These observations discount any rebound appeard last week. No sign of recovery at this point of time.

Filed Under: Old blog archive

  • « Go to Previous Page
  • Page 1
  • Interim pages omitted …
  • Page 9
  • Page 10
  • Page 11
  • Page 12
  • Page 13
  • Go to Next Page »

Primary Sidebar

Best Tools For Traders

Recommend FX Charting

Footer

Recommended FX Charting

Recommended Training

FXSAnalytics
Price Action Course for Professionals

Copyright © 2025 · Affiliate Disclosure · Privacy

We use cookies to ensure that we give you the best experience on our website. If you continue to use this site we will assume that you are happy with it.Ok