• Skip to primary navigation
  • Skip to main content
  • Skip to primary sidebar
  • Skip to footer

TraderGav.com

Gav's trading blog - Perseverance, Consistency, Confidence

  • Home
  • Start Here
    • Back to Basics of Trading
    • Resource For Traders – The Best Tools for Traders
    • Learn Trading Articles
    • Sierra Chart Resource
  • Blog
    • Blog Posts
    • Other learning resource
    • Dummy Collection
    • Harmonic setups
  • About Me

Chart of the moment

Updated chart of $NZDUSD 13 September 2010

by Gav Leave a Comment

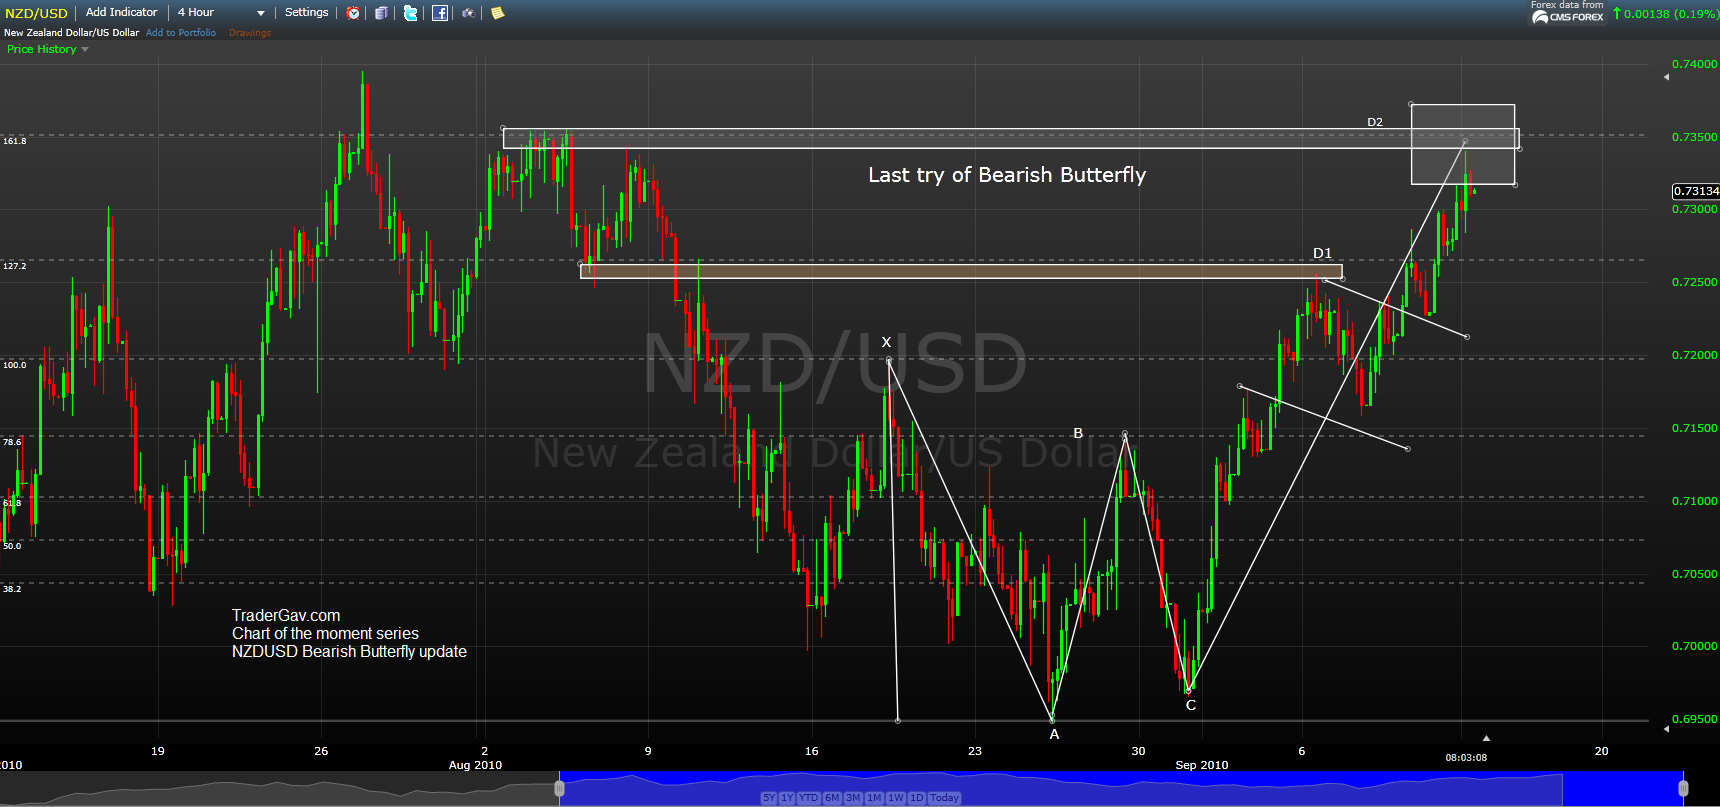
So now we are in the vicinity of 161.8%, and the last valid D of Bearish butterfly. Kiwi touched 0.7345 during Monday London session. We shall see if the pattern is to hold or invalidated soon. Short stop is above 0.7350

Here is the updated Chart, the Butterfly.

NZDUSD Bearish Butterfly

Filed Under: Harmonic setups, Trading Journal Tagged With: Bearish Butterfly, Chart of the moment, FX, NZDUSD, Trading Journal

$EURJPY 13 Sep 2010 , a butterfly flying?

by Gav 2 Comments

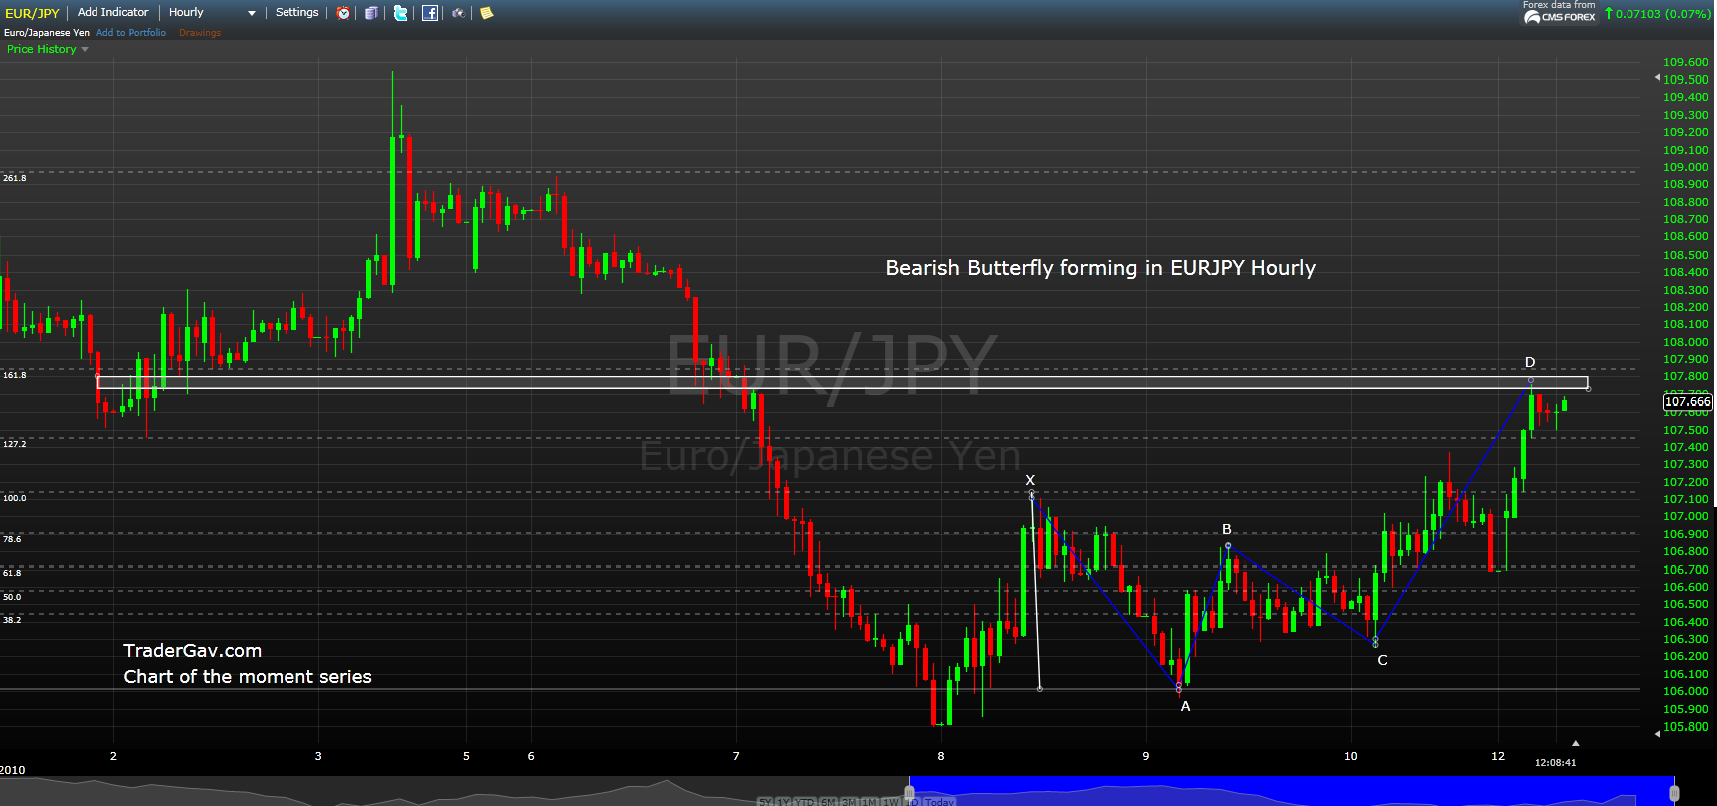
It is harmonic time again! 🙂

A Bearish Butterfly is found to be ‘secretly forming in hourly chart of EURJPY.  And we are now at 1.618% extension level. Let’s see how it works out later.

Here is the… Butterfly!

Bearish Butterfly in EURJPY

Filed Under: Harmonic setups, Trading Journal Tagged With: Bearish Butterfly, Chart of the moment, EURJPY, FX, Trading Journal

Chart of the moment: $CADJPY 13 September 2010

by Gav Leave a Comment

This is the chart that caught my eyes this morning. CADJPY is back to the resistance zone again. Let’s see how it will play out.

Here is the.. CHART!

Chart of the moment CADJPY

Trade Well.

Filed Under: Chart of the moment, Trading Journal Tagged With: CADJPY, Chart of the moment, FX, Trading Journal

Updated Chart of $NZDUSD Bearish Butterfly

by Gav Leave a Comment

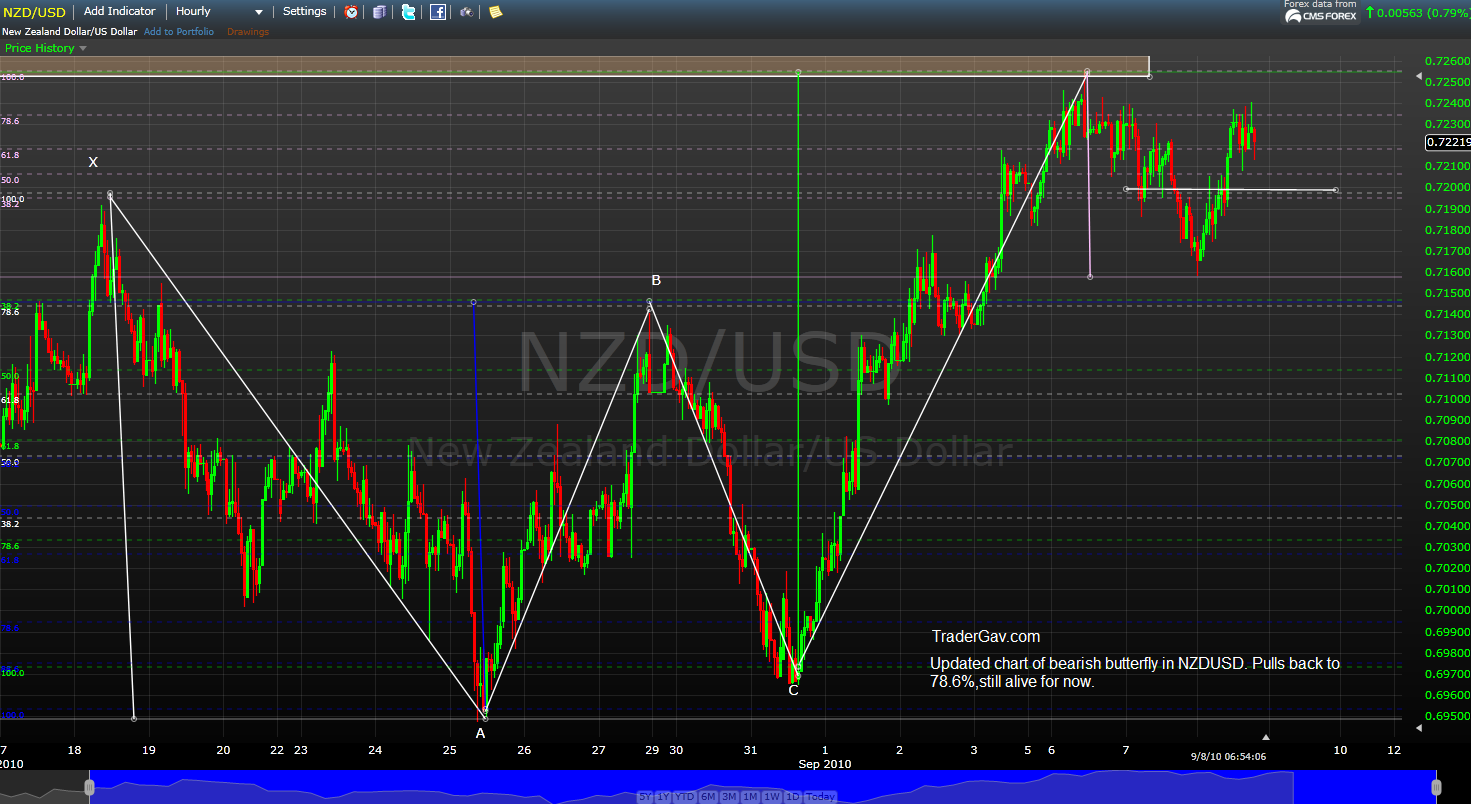
This is the quick update of my previous post of $NZDUSD. Kiwi dollar pulled back to 78.6% of the most recent down swing, the risk was back in town during the Wednesday session. And the bearish Butterfly pattern is still alive for now. I am watching the development of this pattern.

As always, it is easy to find a chart pattern or setup, but the essential skill is to learn how to manage a position. One setup, one pattern, can lead to different sets of result.

Here is the updated chart.

Again, here are some details of the pattern recognition I found it on FX360. Check out the website for details.

The bearish butterfly Pattern Rules

  1. The swing from A to D is a 127.2% or 161.8% extension of XA
    • Note: D must be above X
  2. A valid ABCD must be observed in the extension move (AD)
  3. Additional confirmation may be attained when the times of the XAB and BCD triangles are in proportion
  4. A move beyond 161.8% negates the pattern and may suggest a potentially strong bullish continuation

Filed Under: Harmonic setups, Trading Journal Tagged With: Chart of the moment, FX, NZDUSD, Trading Journal

ABCD $AUDUSD

by Gav Leave a Comment

AndrewUknown pointed out an ABCD formation in the comment section my $AUDUSD post few days ago.  Now the bearish rising wedge might potentially be invalidated, well, it is too early to make the call now, if the bearish wedge failed to realize, we might see 0.9350. I thought I will post the chart here in case, some of my 12 readers are interested in Harmonic patterns.

Here is the Chart (click to view full chart)

Here are some guidelines or rules I took from FX360. They have been actively trading harmonic patterns, check out the website if you are interested in pattern recognition trading.

  1. Point A is a significant low, and point B is a significant high. In the move from A to B there can be no lows below point A, and no highs above point B
  2. Point C must be above point A. In the move from B to C there can be no highs above point B, and no lows below point C
    • Ideally, point C will be 61.8% or 78.6% of AB. (“Classic” ABCD pattern)
    • In strongly trending markets, BC may only be 38.2% or 50% of AB
  3. Point D must be above point B. In the move from C to D there can be no lows below point C, and no highs above point D.
    • CD may equal AB. (AB=CD pattern)
    • CD may be 127.2% or 161.8% of BC (“Classic” ABCD pattern)
    • CD may be 127.2% or 161.8% of AB (ABCD Extension pattern)
  4. There may be additional confirmation when the time of CD is in ratio and proportion to AB
    • CD may be equal to AB in time, or between 61.8%-161.8% of the amount of time it took the AB leg to complete
  5. Watch for price gaps and/or wide-ranging bars in the CD leg, especially as market approaches point D
    • These may be signs of a potential strongly trending market. In this case, expect to see 127.2% or 161.8% price extensions of AB in determining CD completion

Filed Under: Harmonic setups, Trading Journal Tagged With: ABCD, AUDUSD, Chart of the moment, FX, Trading Journal

Chart of the moment: $NZDUSD, a Bearish Butterfly it is

by Gav Leave a Comment

Here is what I see in Kiwi dollar ($NZDUSD). We are looking at a bearish butterfly pattern now, well, in case you are into harmonic pattern.

Again, is the chart trying to tell you something?

Trade well.

Filed Under: Harmonic setups, Trading Journal Tagged With: Bearish Butterfly, Chart of the moment, FX, NZDUSD, Trading Journal

  • « Go to Previous Page
  • Page 1
  • Page 2
  • Page 3
  • Page 4
  • Page 5
  • Page 6
  • Interim pages omitted …
  • Page 9
  • Go to Next Page »

Primary Sidebar

Best Tools For Traders

Recommend FX Charting

Footer

Recommended FX Charting

Recommended Training

FXSAnalytics
Price Action Course for Professionals

Copyright © 2025 · Affiliate Disclosure · Privacy

We use cookies to ensure that we give you the best experience on our website. If you continue to use this site we will assume that you are happy with it.Ok