• Skip to primary navigation
  • Skip to main content
  • Skip to primary sidebar
  • Skip to footer

TraderGav.com

Gav's trading blog - Perseverance, Consistency, Confidence

  • Home
  • Start Here
    • Back to Basics of Trading
    • Resource For Traders – The Best Tools for Traders
    • Learn Trading Articles
    • Sierra Chart Resource
  • Blog
    • Blog Posts
    • Other learning resource
    • Dummy Collection
    • Harmonic setups
  • About Me

Intraday structure of ASX200 26 Feb 2013

by Gav Leave a Comment

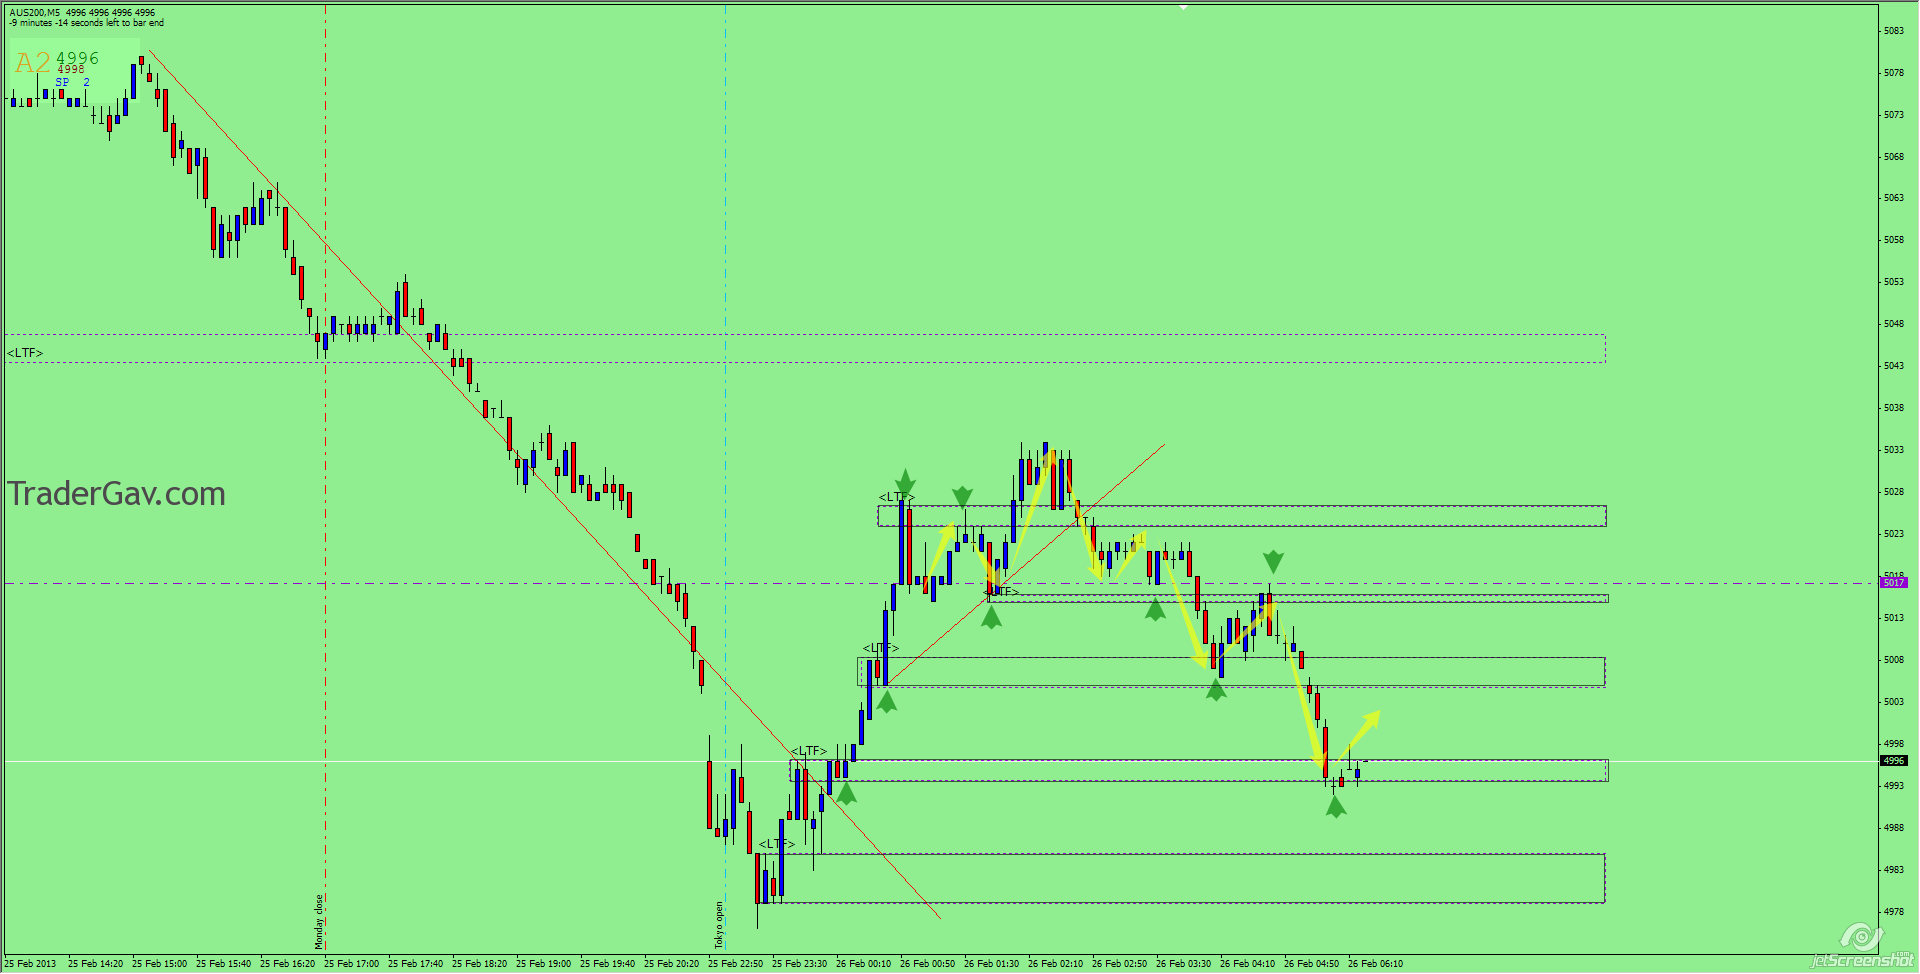
This is not a trade. I thought it might be helpful to post the intraday chart (5-min) of ASX200 index. If one pays enough attention to the chart, it is not too difficult to draw out the structure in terms of supply, demand zones.

First of all, I assume you have the knowledge to identify supply, demand zones. Support , resistance level is just the cluster of supply demand zones. The basis of this analysis is , price tends to rebound at the demand zone (reverse is true for short side), and the broken level tends to serve the opposite.

Have a look at the 5-minute chart below.

ASX200 M5
ASX200 M5

Filed Under: Price Action trade, Trading Journal Tagged With: ASX200, SD-PA

Reader Interactions

Leave a Reply Cancel reply

Your email address will not be published. Required fields are marked *

Primary Sidebar

Best Tools For Traders

My Name is Gav.
I am a Father, Husband, Trader, And Blogger. A serious coffee addict. I started training since 2005, mainly on FX and Futures.

About Me

Footer

Recommend FX Charting

Recommended Training

FXSAnalytics

Copyright © 2023 · Affiliate Disclosure · Privacy