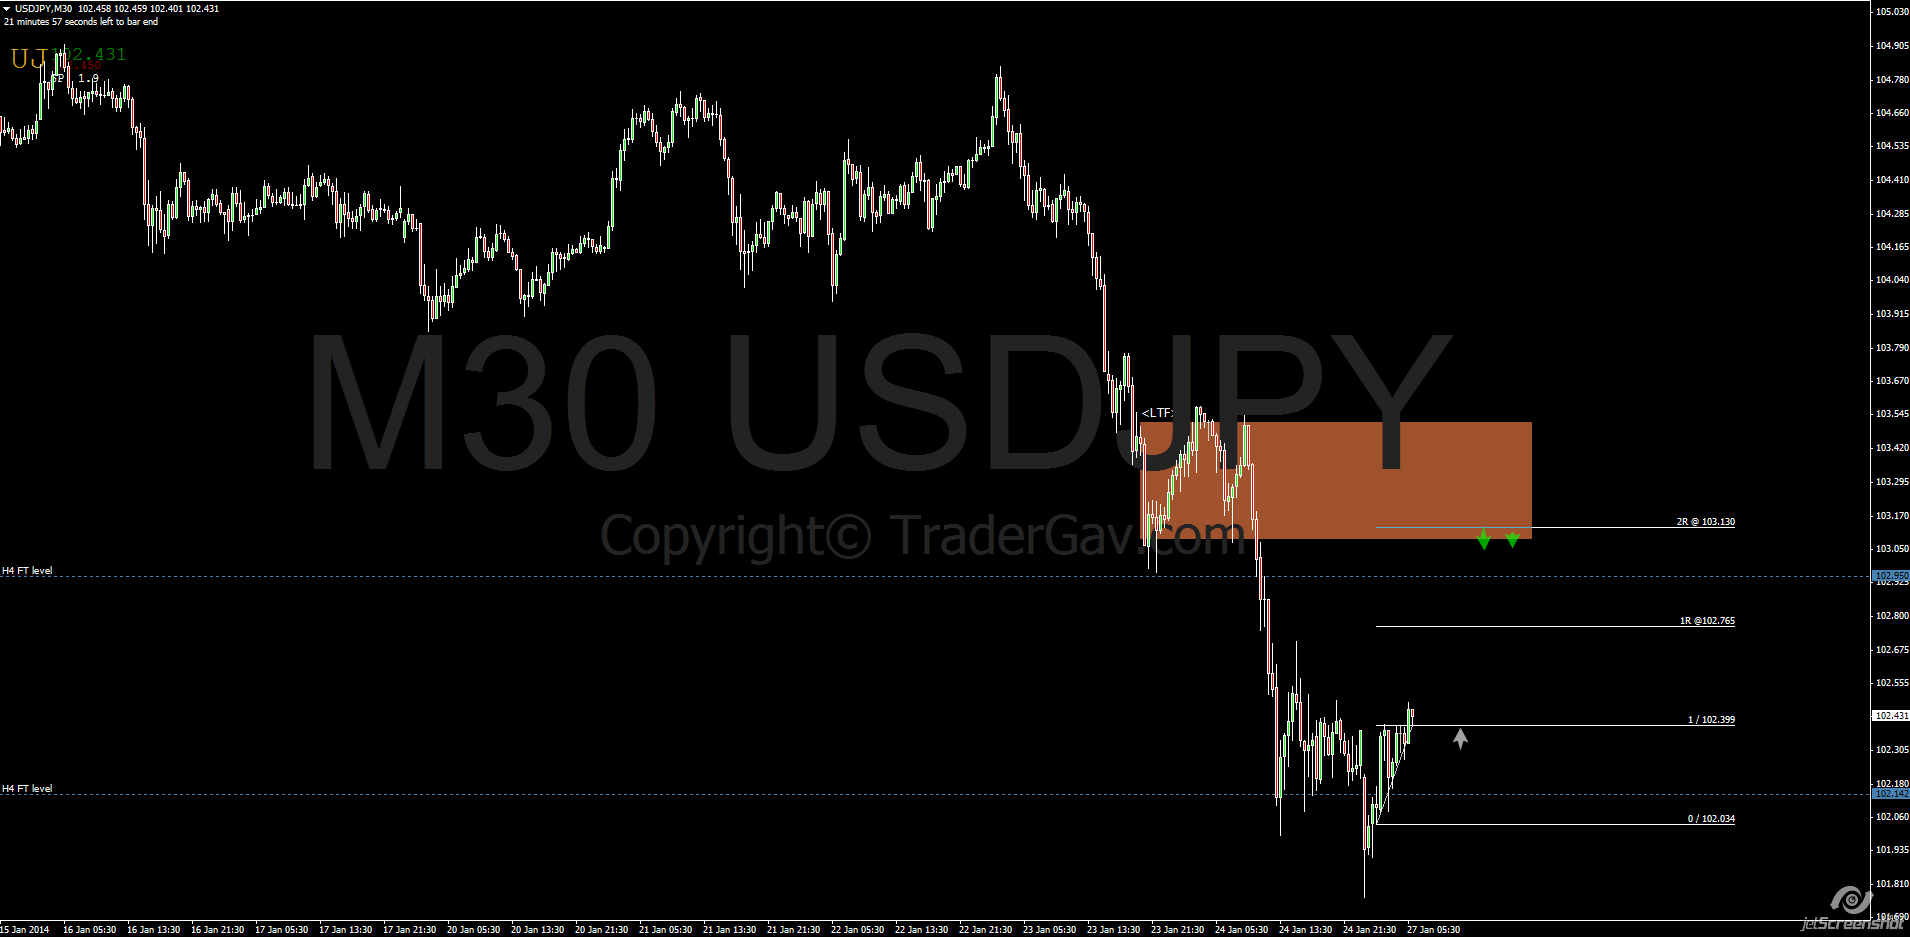
Some spot FX charts for week 27 Jan 2014. Charts include EURJPY, USDJPY, GBPUSD
Price Action trade
Intraday structure of ASX200 26 Feb 2013
This is not a trade. I thought it might be helpful to post the intraday chart (5-min) of ASX200 index. If one pays enough attention to the chart, it is not too difficult to draw out the structure in terms of supply, demand zones. First of all, I assume you have the knowledge to identify […]
$GBPUSD 25 Feb 2013
Just to post a quick chart before the market gets busy again. Cable, $GBPUSD , zone around 1.5235 might provide some trading opportunity. The confluence of supply line and zone, and SR flipped zone. I am watching this level closely.
$USDJPY potential reaction zone 21 Feb 2013
[tab: Setup 21 Feb 2013] I am looking at the zone around 92.75 of USDJPY for some reactions. It is a retest of H1, H4 uptrend line and also the base of last spike. Let’s see how it goes. [tab: update 22 Feb 2013] It depends on the buffer you’ve set, or if you leave […]
ASX200 06 September 2011
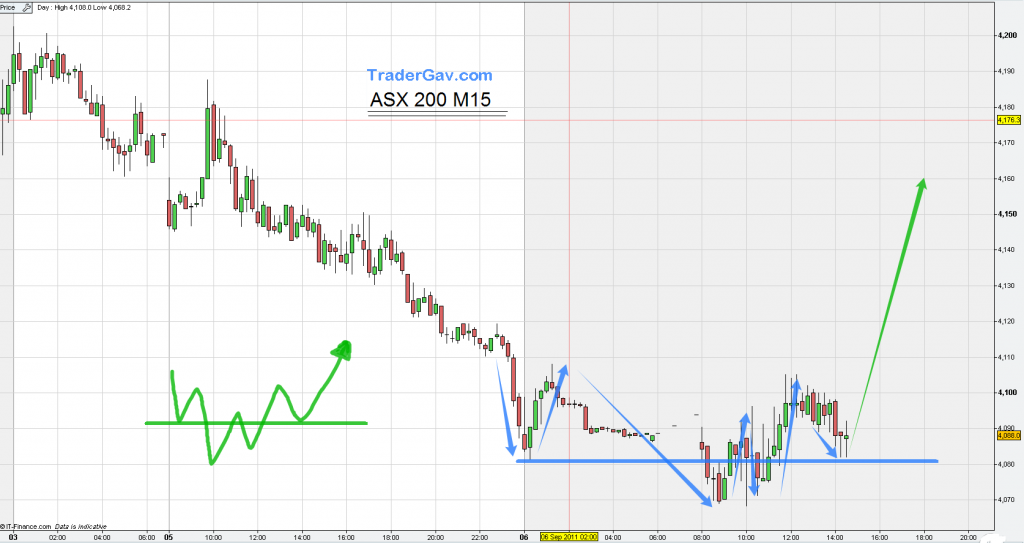
[tab:Setup] After RBA’s decision to leave cash rate on hold at 4.75%, I see an interesting setup in ASX200. This is an intraday trade setup. I am testing the idea with small risk. As long as the last low holds well, long bias remains. Let’s see how it works out. Here is the …. CHART! […]
$AUDUSD 12 August 2011
I am watching AUDUSD during Asian session. I thought we might have some interesting setups forming soon. Let’s see. Here is the….CHART!

