• Skip to primary navigation
  • Skip to main content
  • Skip to primary sidebar
  • Skip to footer

TraderGav.com

Gav's trading blog - Perseverance, Consistency, Confidence

  • Home
  • Start Here
    • Back to Basics of Trading
    • Resource For Traders – The Best Tools for Traders
    • Learn Trading Articles
    • Sierra Chart Resource
  • Blog
    • Blog Posts
    • Other learning resource
    • Dummy Collection
    • Harmonic setups
  • About Me

Trading Journal

Day review: YM 08 Jan 2015

by Gav Leave a Comment

EOD YM 08 Jan 2015
EOD YM 08 Jan 2015

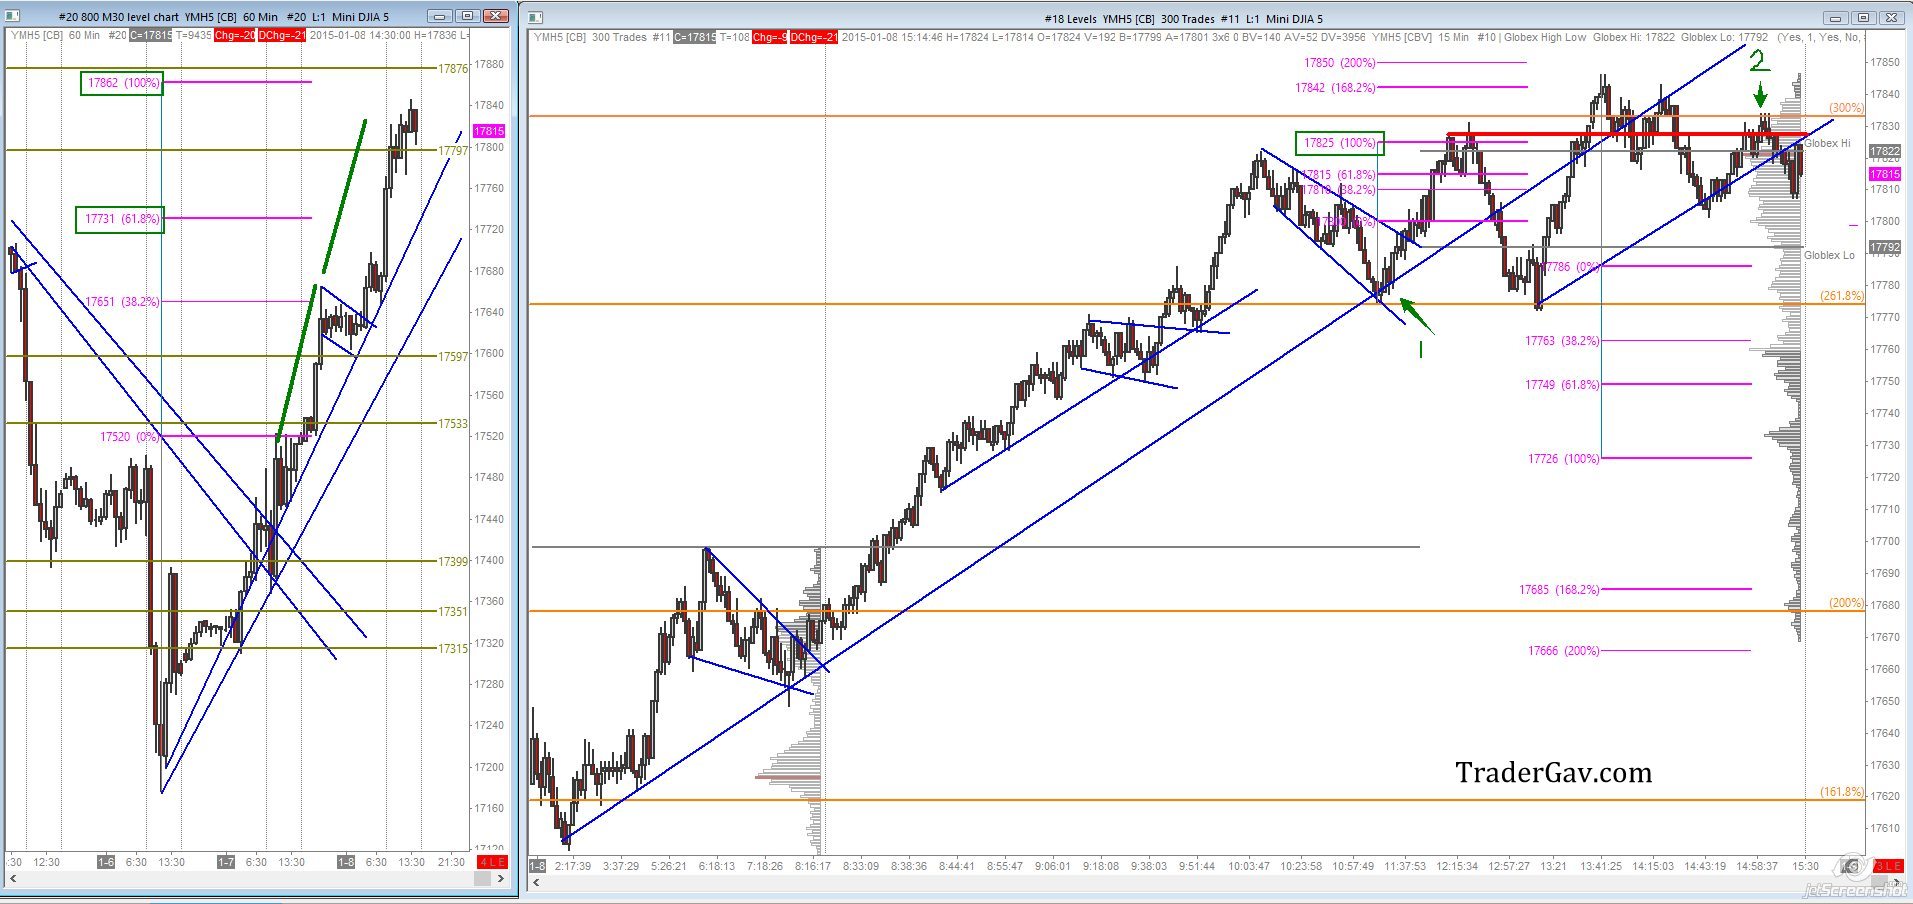
There were a couple of entry setups formed during Asian session (if you even watched this market during that hours), otherwise, YM was grinding up in the RTH morning, patience was required to wait for entry opportunity (well, at least for my type of trading).

Looking at the context in hourly chart on the left, the movement during pre-market/Asian session, was the first leg of buying, and with the tight range followed. I expected another leg up during RTH before considering fading this move. So, I was looking for long all morning.

The retest of uptrend line, and also, the day’s developing Value High (not visible in the EOD chart), which was around 17785 provided a long entry with target around 17825.

A potential short which appeared near the end of RTH was around 17827, an Over-and-Under formed at the break of intraday uptrend line. This setup was ignored due to the time of day. (I don’t hold overnight position).

That’s it for me in this pre NFP Thursday session.

Have a safe trading day.

Filed Under: Dummy 3.0, headline post, Trading Journal Tagged With: Dummy Trading Mini Dow, Trading Journal

Day review: YM 07 Jan 2015

by Gav Leave a Comment

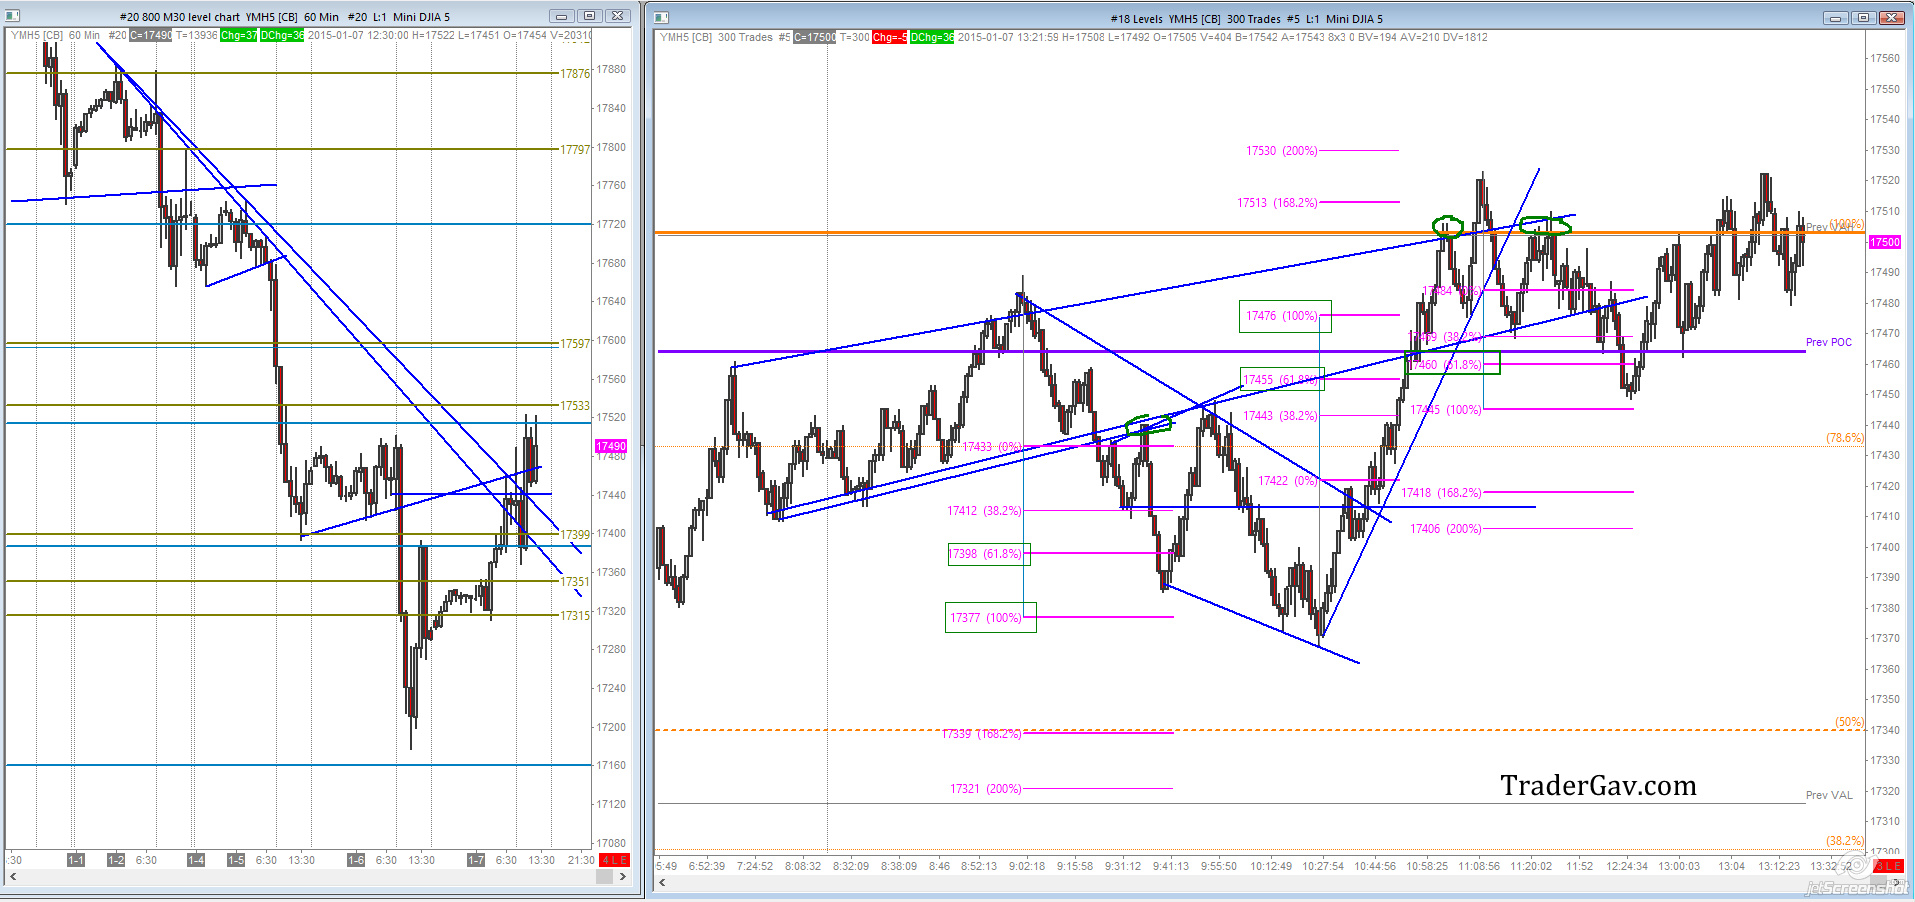
Here is a quick review of YM for the past day. Since the principle of these trades are closed to Dummy trading , which is “To limit risk by better market timing”, I categorize this series of post under Dummy Collection.

EOD YM 07 Jan 2015
EOD YM 07 Jan 2015

Looking at the context, the hourly chart at the right,  downtrend is clearly observed.  One interesting point is the V-shaped reversal from 17200. I expect the high/source of previous supply 17502 to be tested. I don’t immediately fade these supply , demand zone, instead, I prefer to see price trade into them and decide the next step of action.

There were a couple of trading opportunities appeared in yesterday’s session.

First one was the break and retest of the uptrend line, which was around 17433. This is a mean reversion trade for me. YM traded above current day’s developing value area, and auctioned back into value area of the day. I expected the day’s developing value (VWAP, not shown in the chart) around 17398 to be tested, in other words, I expect YM to, at least, trade into VWAP from here.

Second setup was when YM went back up to yesterday’s RTH high.  A break of uptrend line with over-and-under pattern (credit to Steve W from NoBrainerTrades for this concept) form at this point. A short at the retest 17502, with target back into the day’s developing value area, confluence with 1.618 measured move target around 17460.

Those were two obvious trade opportunities I found yesterday in between ADP release and FOMC meeting minutes.

Have a good day.

Filed Under: Dummy 3.0, headline post, Trading Journal Tagged With: Dummy Trading Mini Dow, Trading Journal

GBPUSD trade the obvious?

by Gav

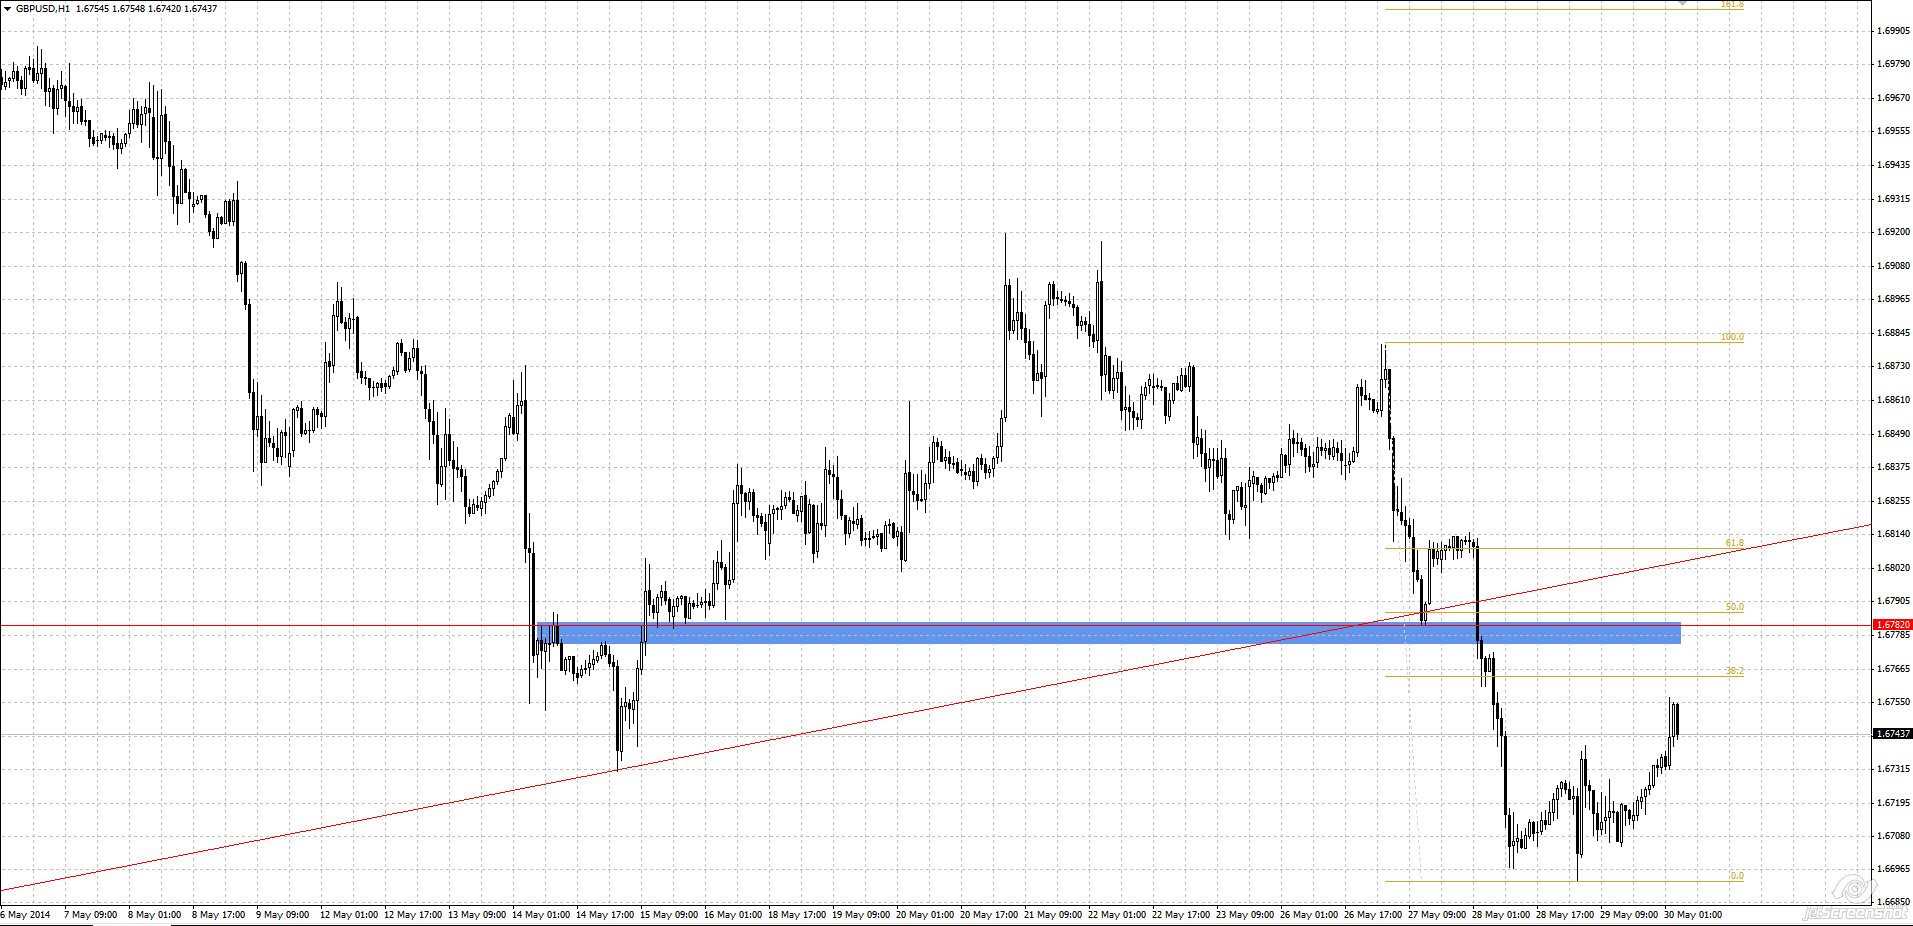
Just thought I would post a chart here. This is a text book style support-resistance setup. Trade the obvious?

Have a look at larger time frame to set your bias. This setup might be provide you a good entry.

GBPUSD Hourly
GBPUSD Hourly

Filed Under: headline post, Support Resistance, Trading Journal Tagged With: GBPUSD

A small writing project : “Combine”

by Gav

 Combine: a harvesting machine that heads, threshes, and cleans grain while moving over a field

I am planning to write a series of blog posts to list out each elements that I use in my trading.  While I am not sure how long will it take me to write all into blog posts, I will try my best. I see some benefits of doing this:

  1. Refresh and review of my memory and understanding of key concepts
  2. Sharing and receiving comments from readers who might be more experience than I do in some areas, so, I can learn from them.
  3. Putting my “mind-map” into words for review and correction.

From time to time, some questions such as, “Do I really understand this concept?”,  “Is this the most efficient way of working/analyzing?” pop out in my mind.  I think by spending some time to actually write down as a blog post might reveal the possible incompetence of my own, and provide me a chance to correct them. Again, this is going to take time, hopefully, time and energy permit, there will be no big delays between posts. And another important note is, I am not trying to act as an expert here, I am still learning, always do, so, just take it as reading the learning journal of a trader.

Anyway, here are some topics in my mind:

  • Volume profile
  • Auction Theory, Acceptance and Rejections
  • Volume profiling and Levels
  • Order Flow analysis
  • Tools: Charting setup, DOM and Number Bars (Footprint chart)
  • Put it together

I might add in more topics later. Hopefully, this small project will unfold into something helpful and interesting. If you are interested in following this project, the best way is to sign up the Free Trading ideas & Email Updates at the sidebar or simply follow this link.

That’s it for now.  The first post of Project Combine is coming soon..stay tuned.

Good trading.


Filed Under: headline post, Project combine

FX charts Week 27 Jan 2014
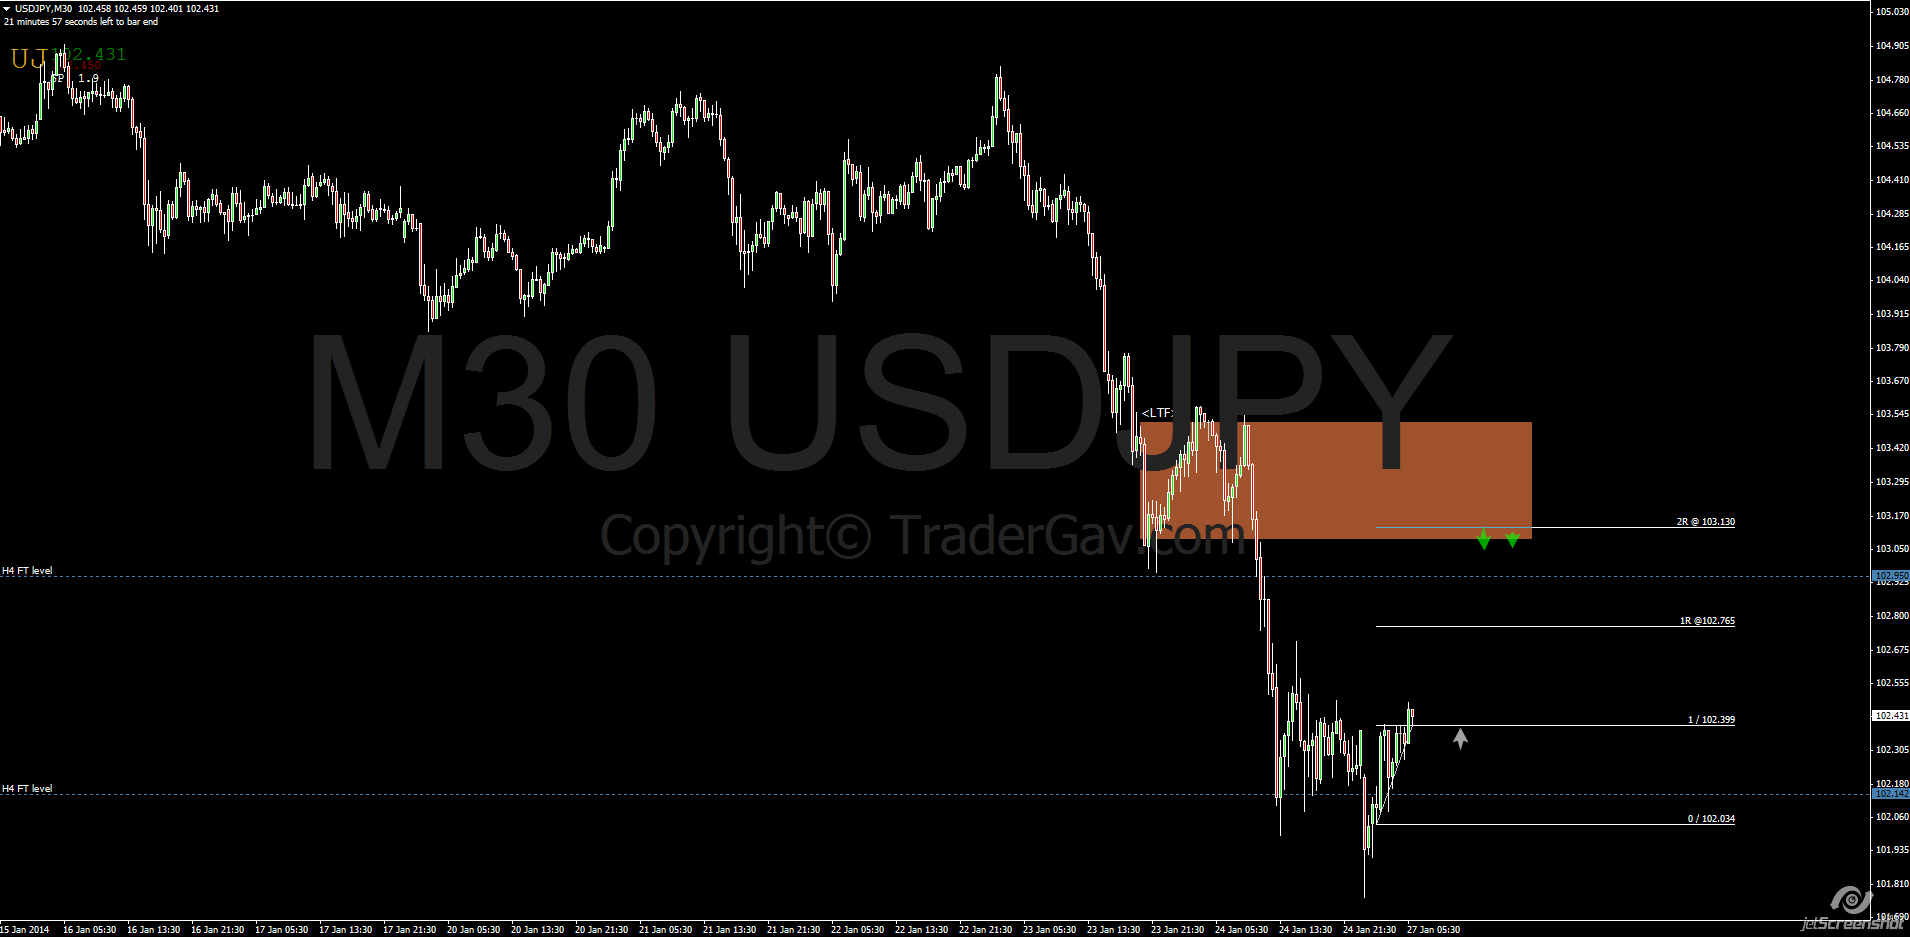
by Gav 1 Comment

Here are some spot FX charts to start the week. Do shoot me a comment if you have any question.

USDJPY 27 Jan 2014
USDJPY
GBPUSD 27 Jan 2014
GBPUSD
EURJPY 27 Jan 2014
EURJPY
NZDUSD 27 Jan 2014
NZDUSD


Filed Under: headline post, Price Action trade, Trading Journal

FX charts for week 21 Oct 2013

by Gav Leave a Comment

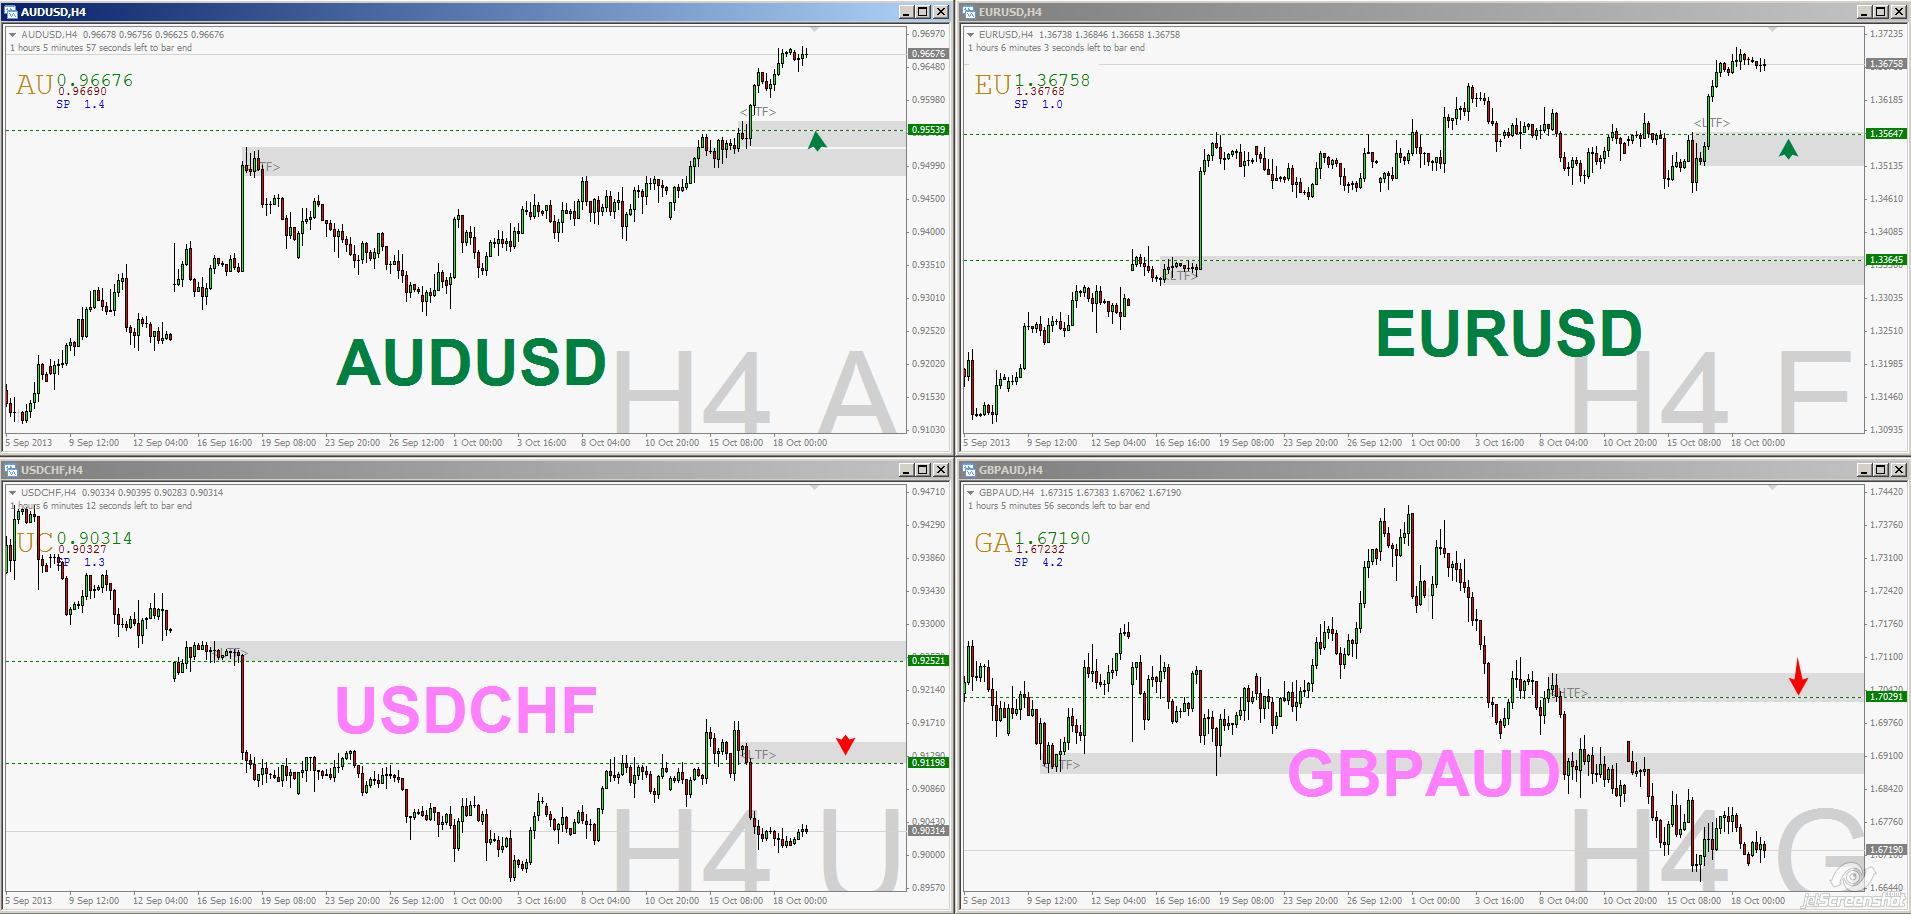
While  my  main focus is in Futures trading, I am still keep an eye  on spot FX for swing trading ideas. Just thought I would share some FX charts which I am watching.

I hope these charts help. You can always click on the charts to view in original size.

AUDUSD:

Still looking at buy on dips.

AUDUSD H4
AUDUSD H4

EURUSD:

Looking to buy at dips

EURUSD H4
EURUSD H4

USDCHF

Looking at potential short around 0.9120

USDCHF H4
USDCHF H

GBPAUD

Looking at potential short around 1.7030

GBPAUD H4
GBPAUD H4

Filed Under: headline post, Support Resistance, Trading Journal

  • « Go to Previous Page
  • Page 1
  • Interim pages omitted …
  • Page 8
  • Page 9
  • Page 10
  • Page 11
  • Page 12
  • Interim pages omitted …
  • Page 124
  • Go to Next Page »

Primary Sidebar

Best Tools For Traders

Recommend FX Charting

Footer

Recommended FX Charting

Recommended Training

FXSAnalytics
Price Action Course for Professionals

Copyright © 2025 · Affiliate Disclosure · Privacy

We use cookies to ensure that we give you the best experience on our website. If you continue to use this site we will assume that you are happy with it.Ok