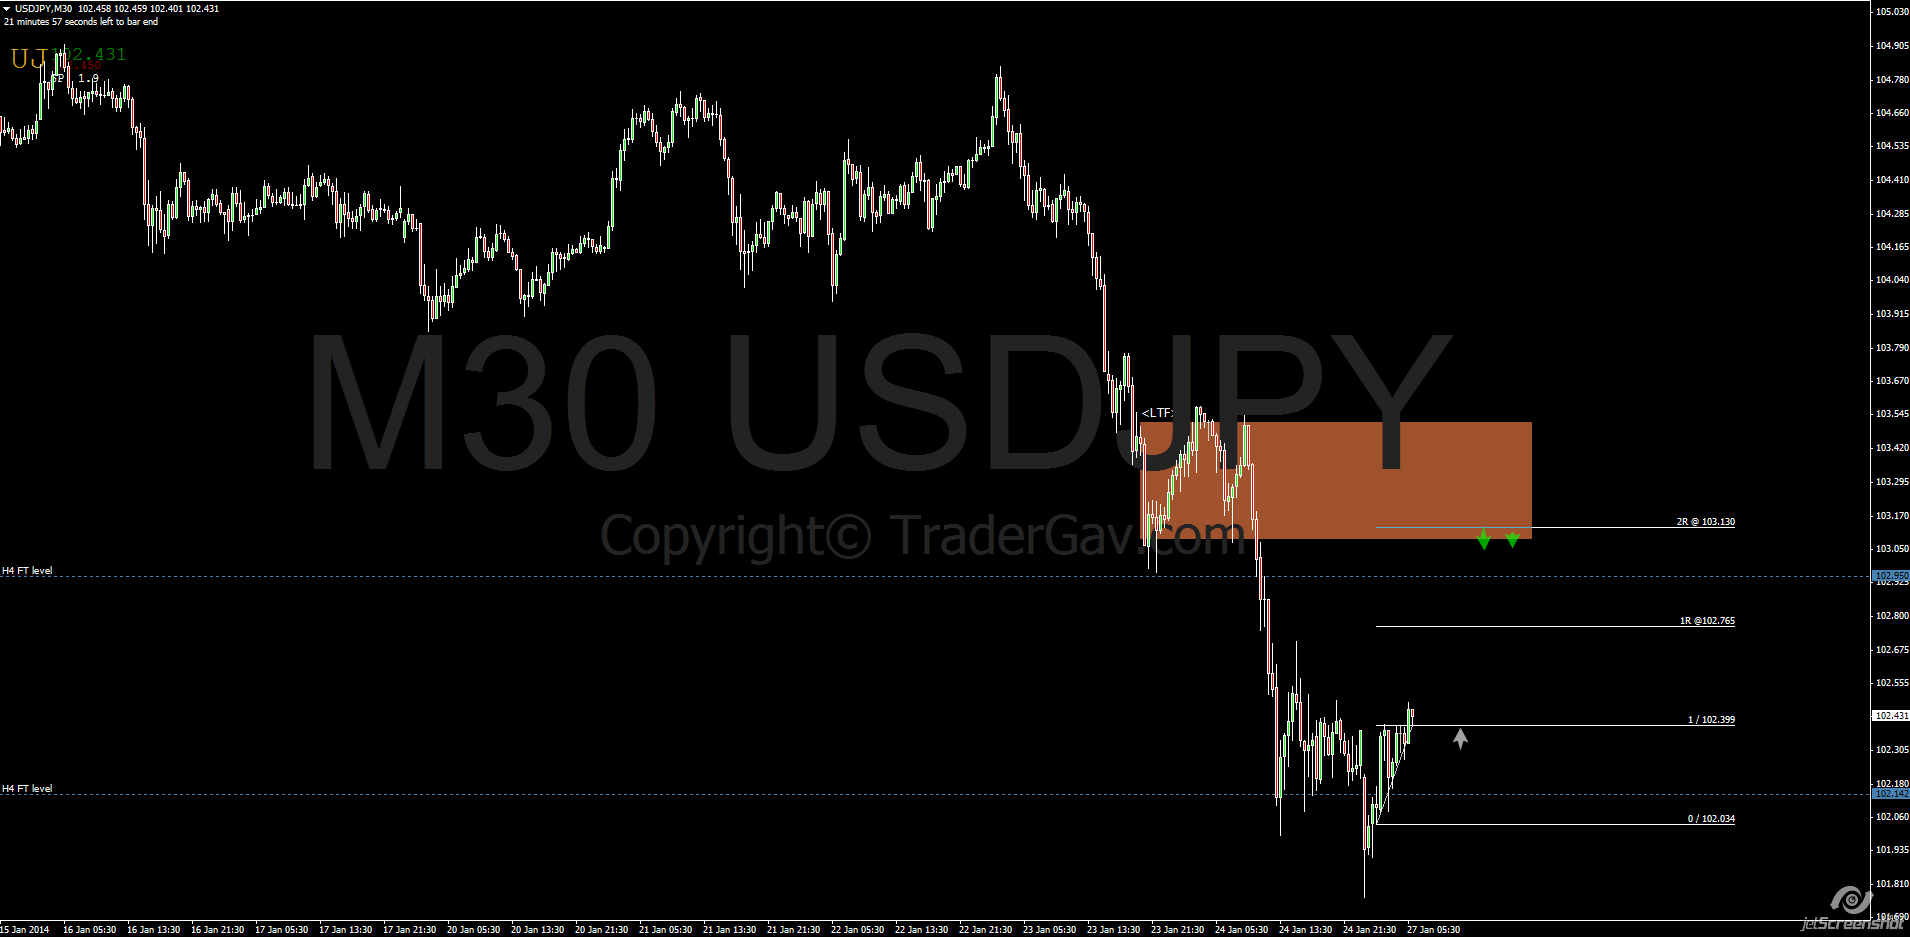
Just thought I would post a chart here. This is a text book style support-resistance setup. Trade the obvious?
Have a look at larger time frame to set your bias. This setup might be provide you a good entry.
Just thought I would post a chart here. This is a text book style support-resistance setup. Trade the obvious?
Have a look at larger time frame to set your bias. This setup might be provide you a good entry.
Combine: a harvesting machine that heads, threshes, and cleans grain while moving over a field I am planning to write a series of blog posts to list out each elements that I use in my trading. While I am not sure how long will it take me to write all into blog posts, I will try […]
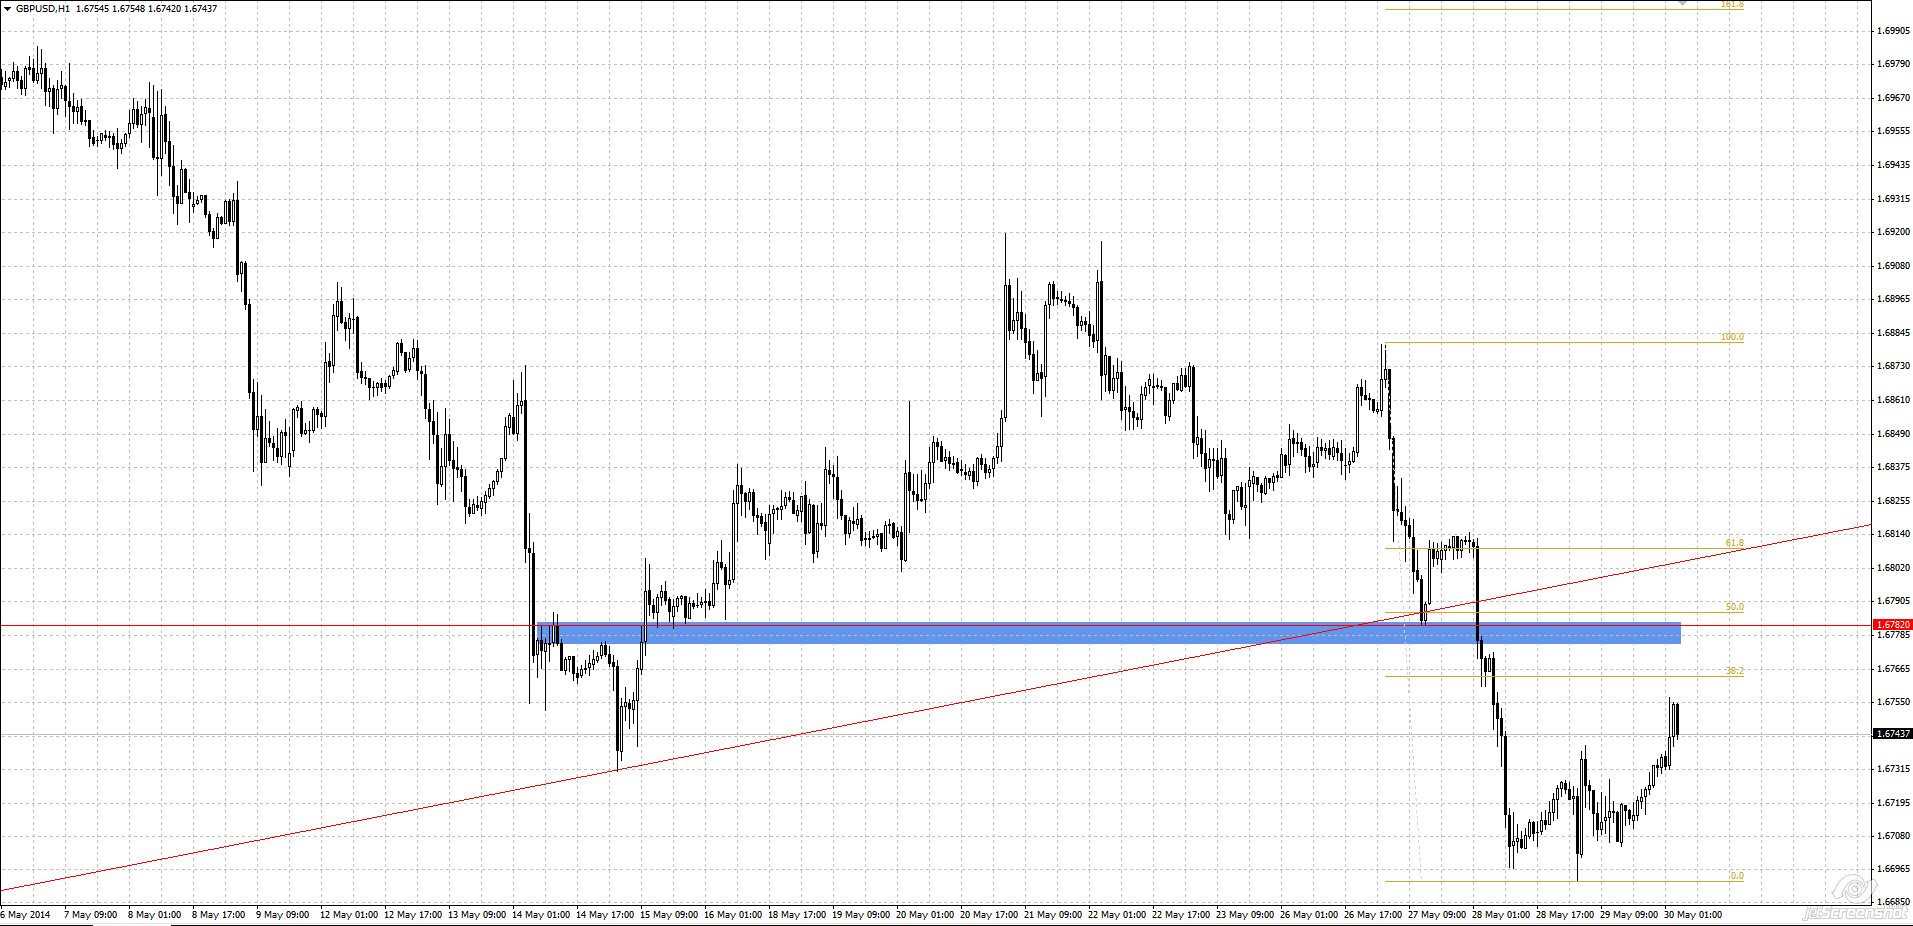
Some spot FX charts for week 27 Jan 2014. Charts include EURJPY, USDJPY, GBPUSD
Wish all my 13 readers a blessed Christmas and a very Happy New Year. Enjoy your well deserved break, and here’s to a super profitable 2014 ahead! *I made a small change to the post title, I think it is important to recognize that we are having days off to celebrate Christmas. Instead of using […]
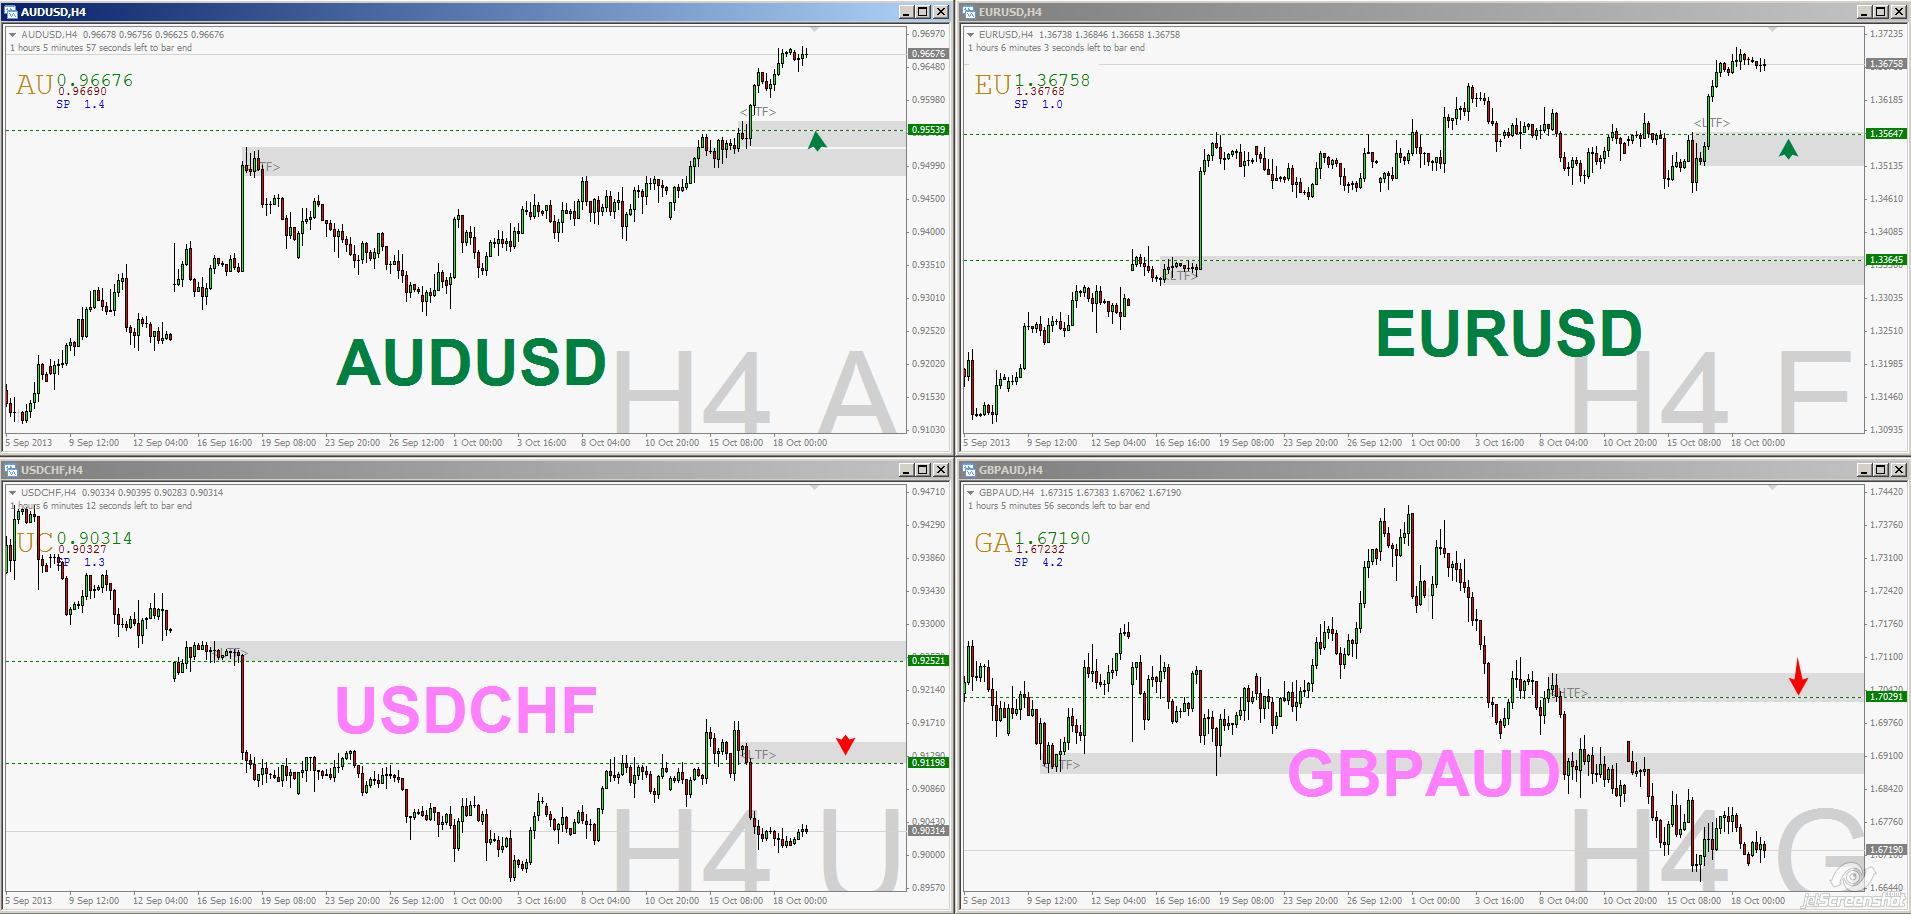
While my main focus is in Futures trading, I am still keep an eye on spot FX for swing trading ideas. Just thought I would share some FX charts which I am watching. I hope these charts help. You can always click on the charts to view in original size. AUDUSD: Still looking at buy […]
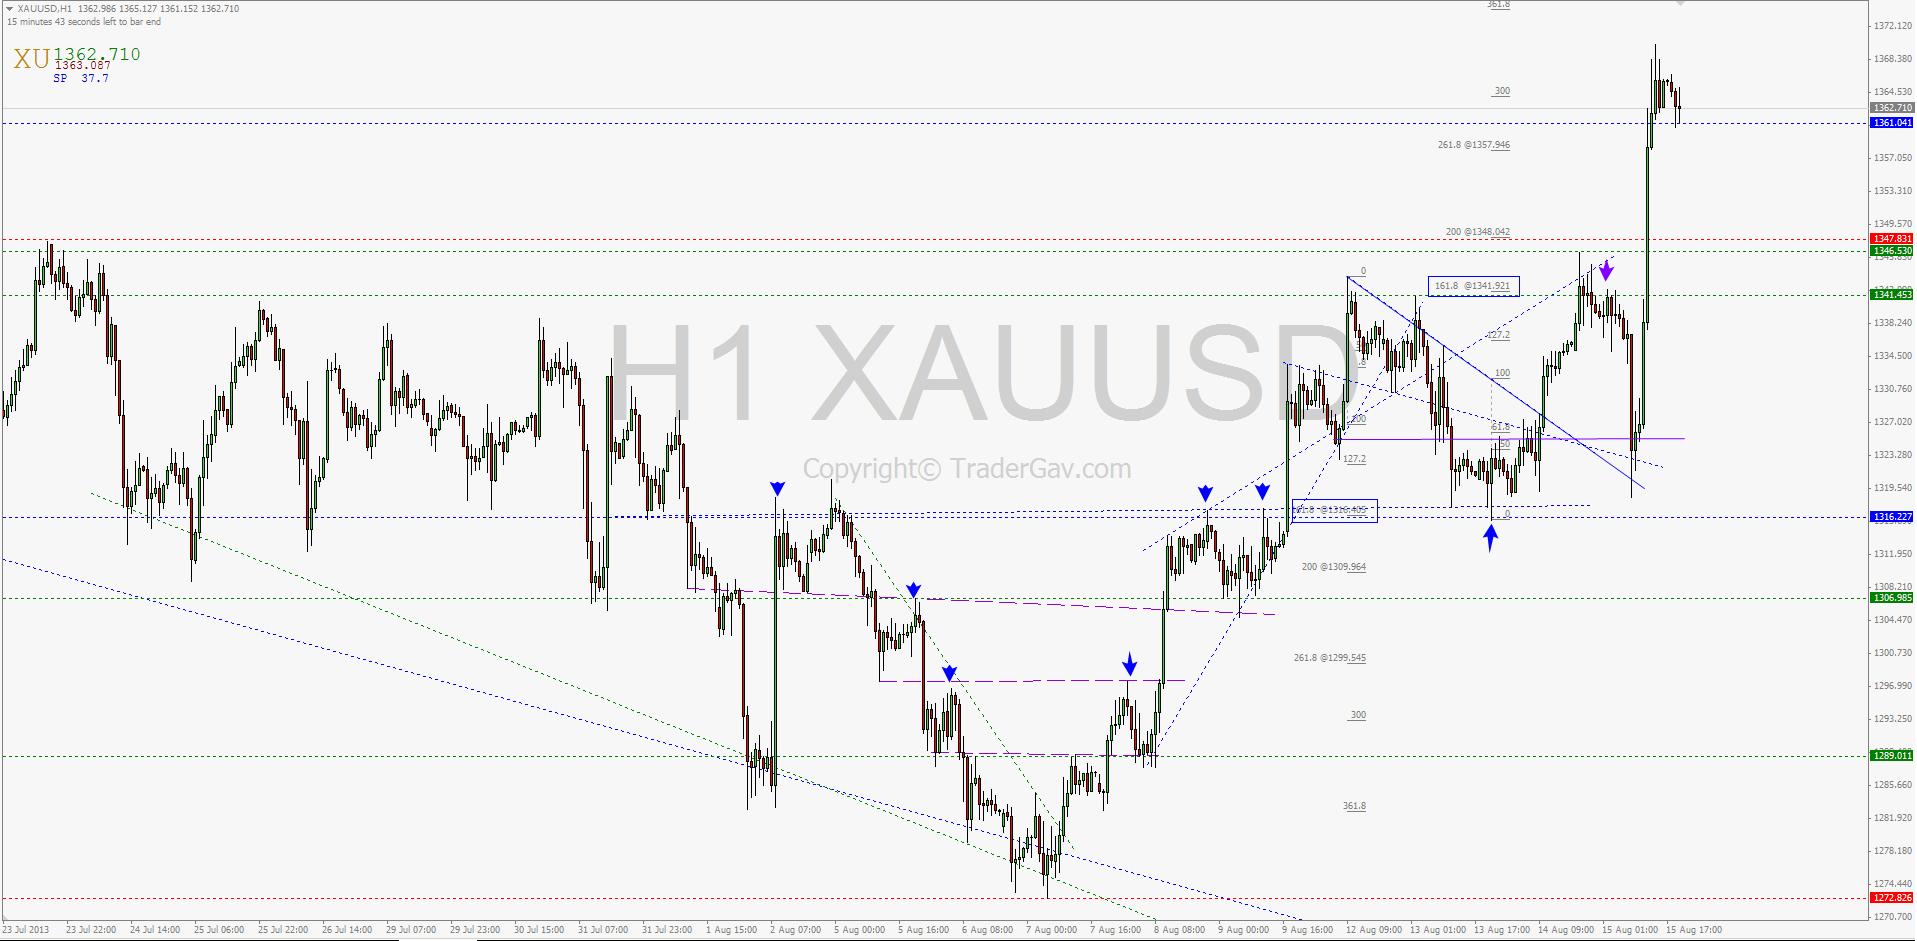
Here is the quick chart review of spot GOLD XAUUSD. You can also find last week’s chart review here. The best way to understand the movement is to look at the charts in multiple time frame. The charts basically explain everything. I will just try to give brief descriptions. On Thursday, Gold broke away from […]