Here is the quick chart review of spot GOLD XAUUSD. You can also find last week’s chart review here.
The best way to understand the movement is to look at the charts in multiple time frame. The charts basically explain everything. I will just try to give brief descriptions.
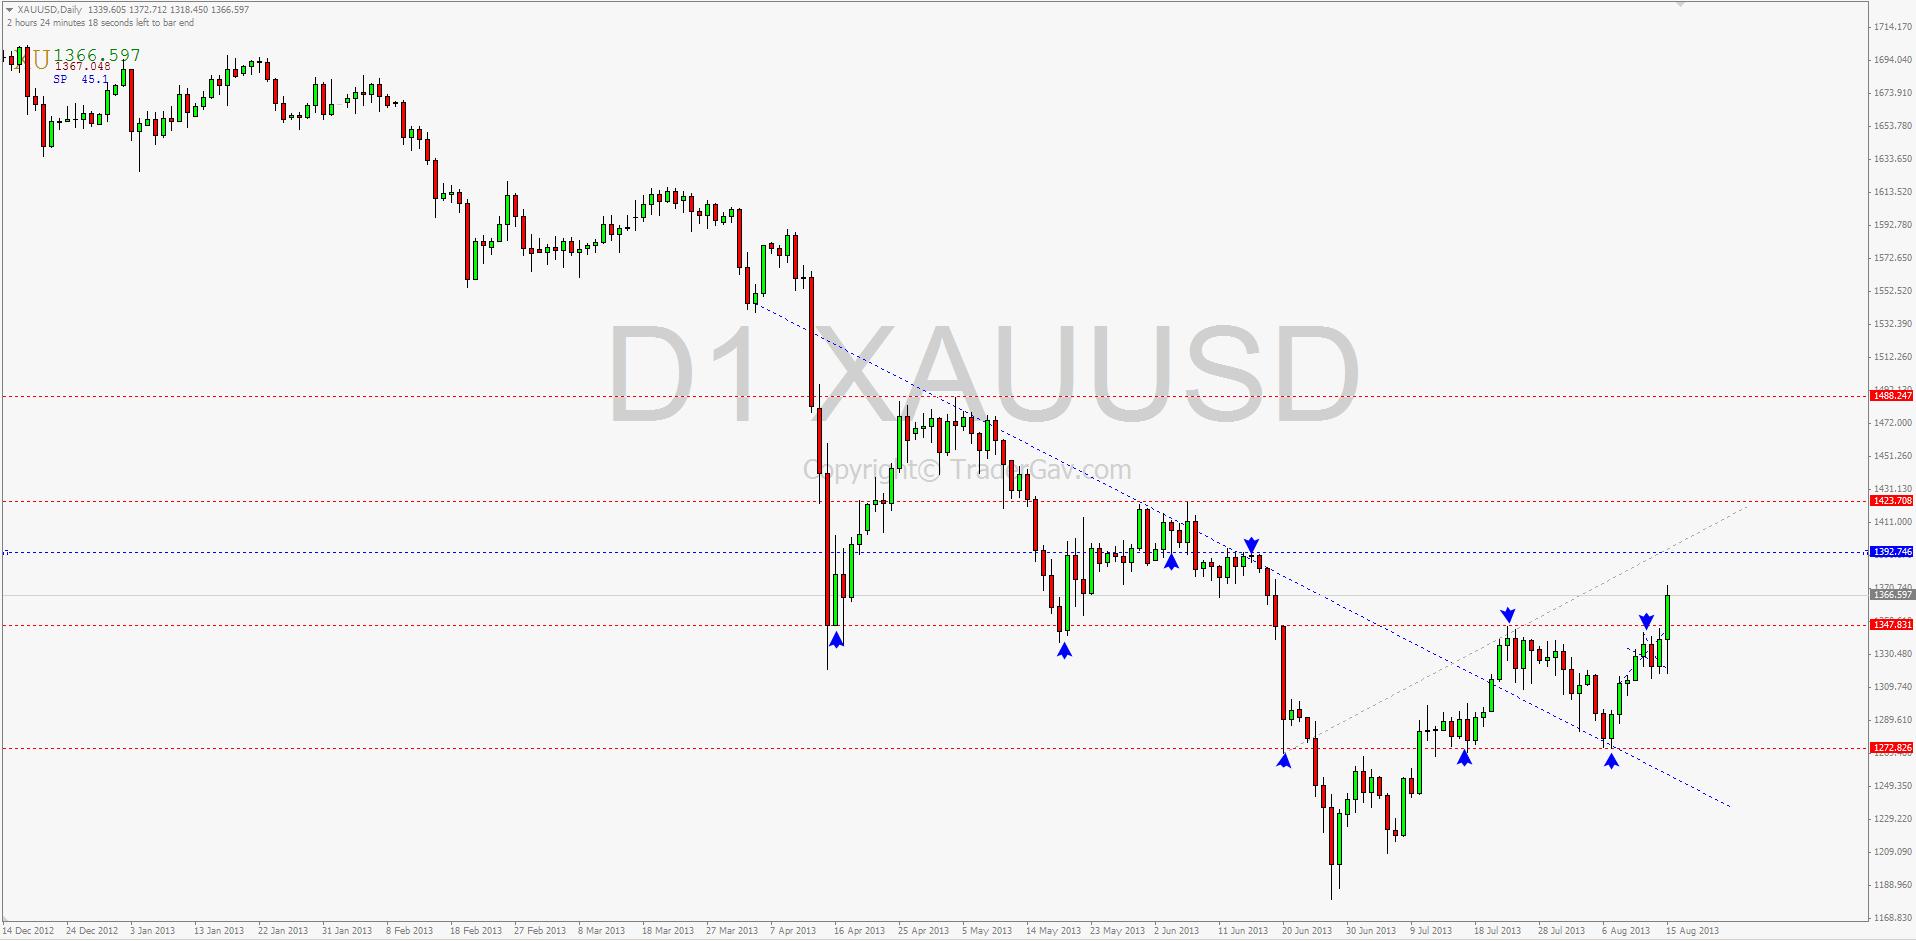
On Thursday, Gold broke away from resistance level 1347.83, the immediate target is seen at 1392/98.
Here is the Daily Chart with key levels marked.

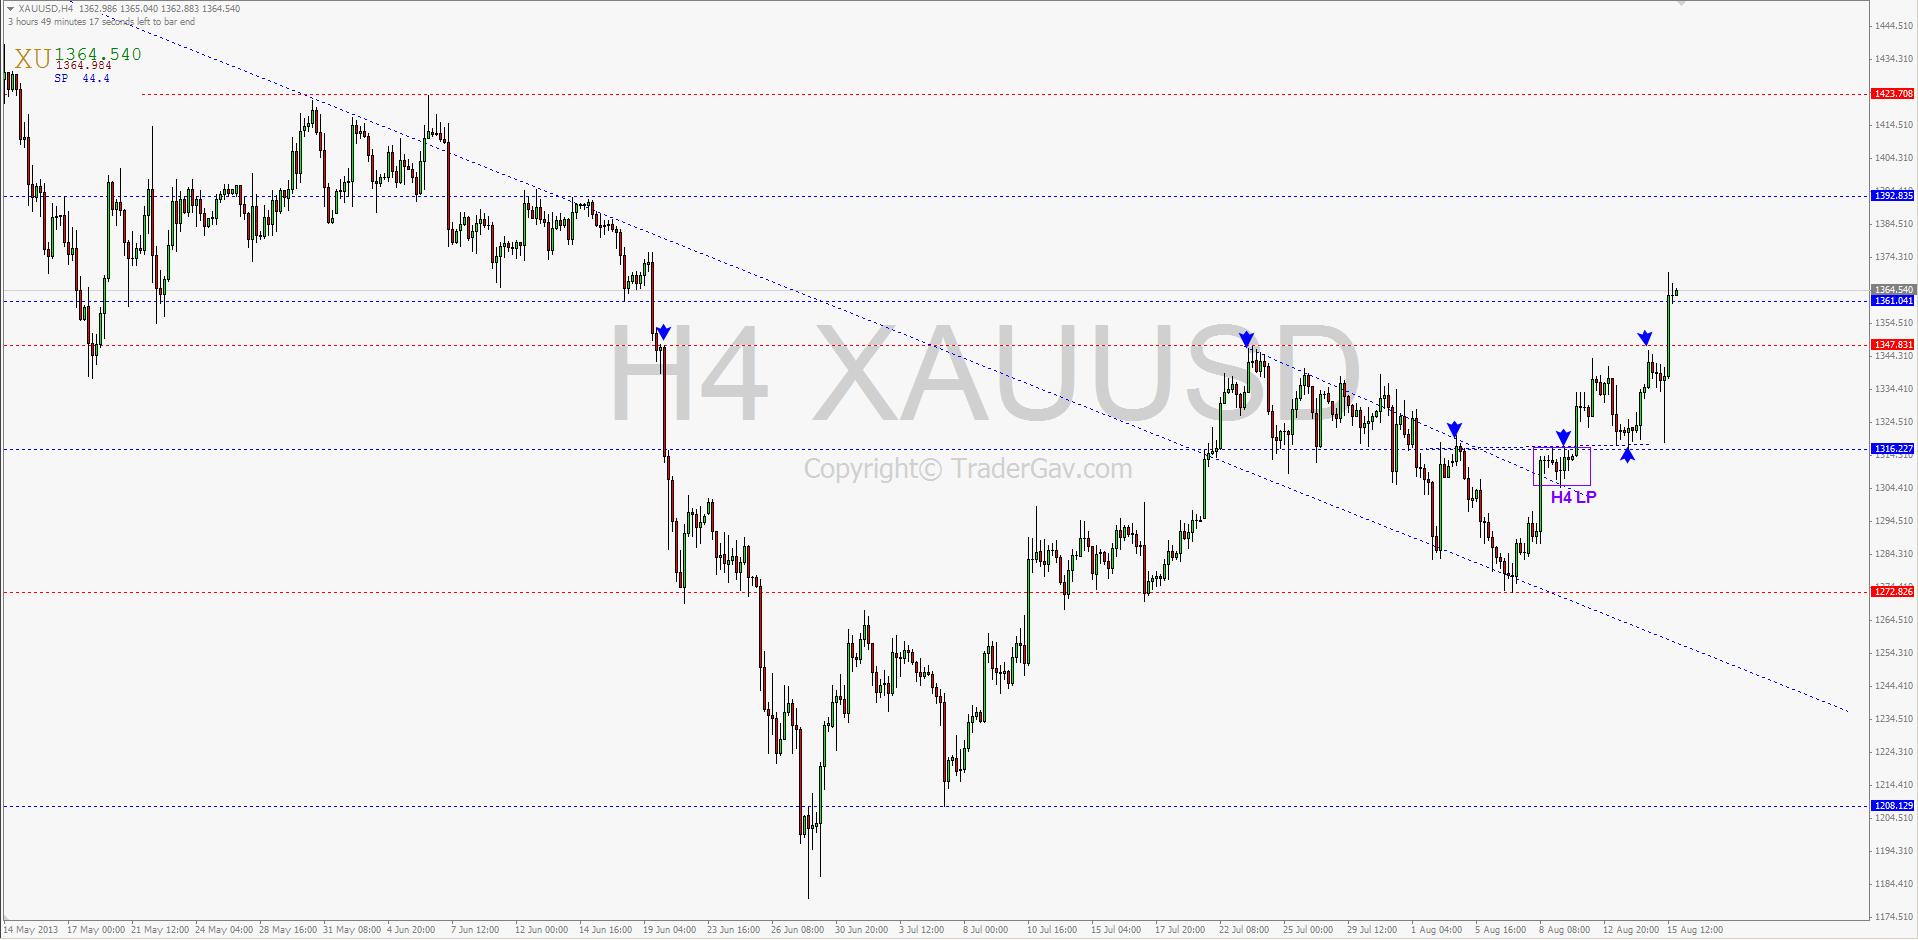
Looking into 4-hour time frame, we can find some details about the price movement. Last week, we saw the break of down trend line, and also the resistance level around 1316.22. The best opportunity,and more conservative way to enter a long trade is to wait for the pull back to the broken resistance level. As shown in the chart, price respected the level 1316.22, and made another run to the upside after retesting the level.
Here is the 4-hour chart with key levels marked.

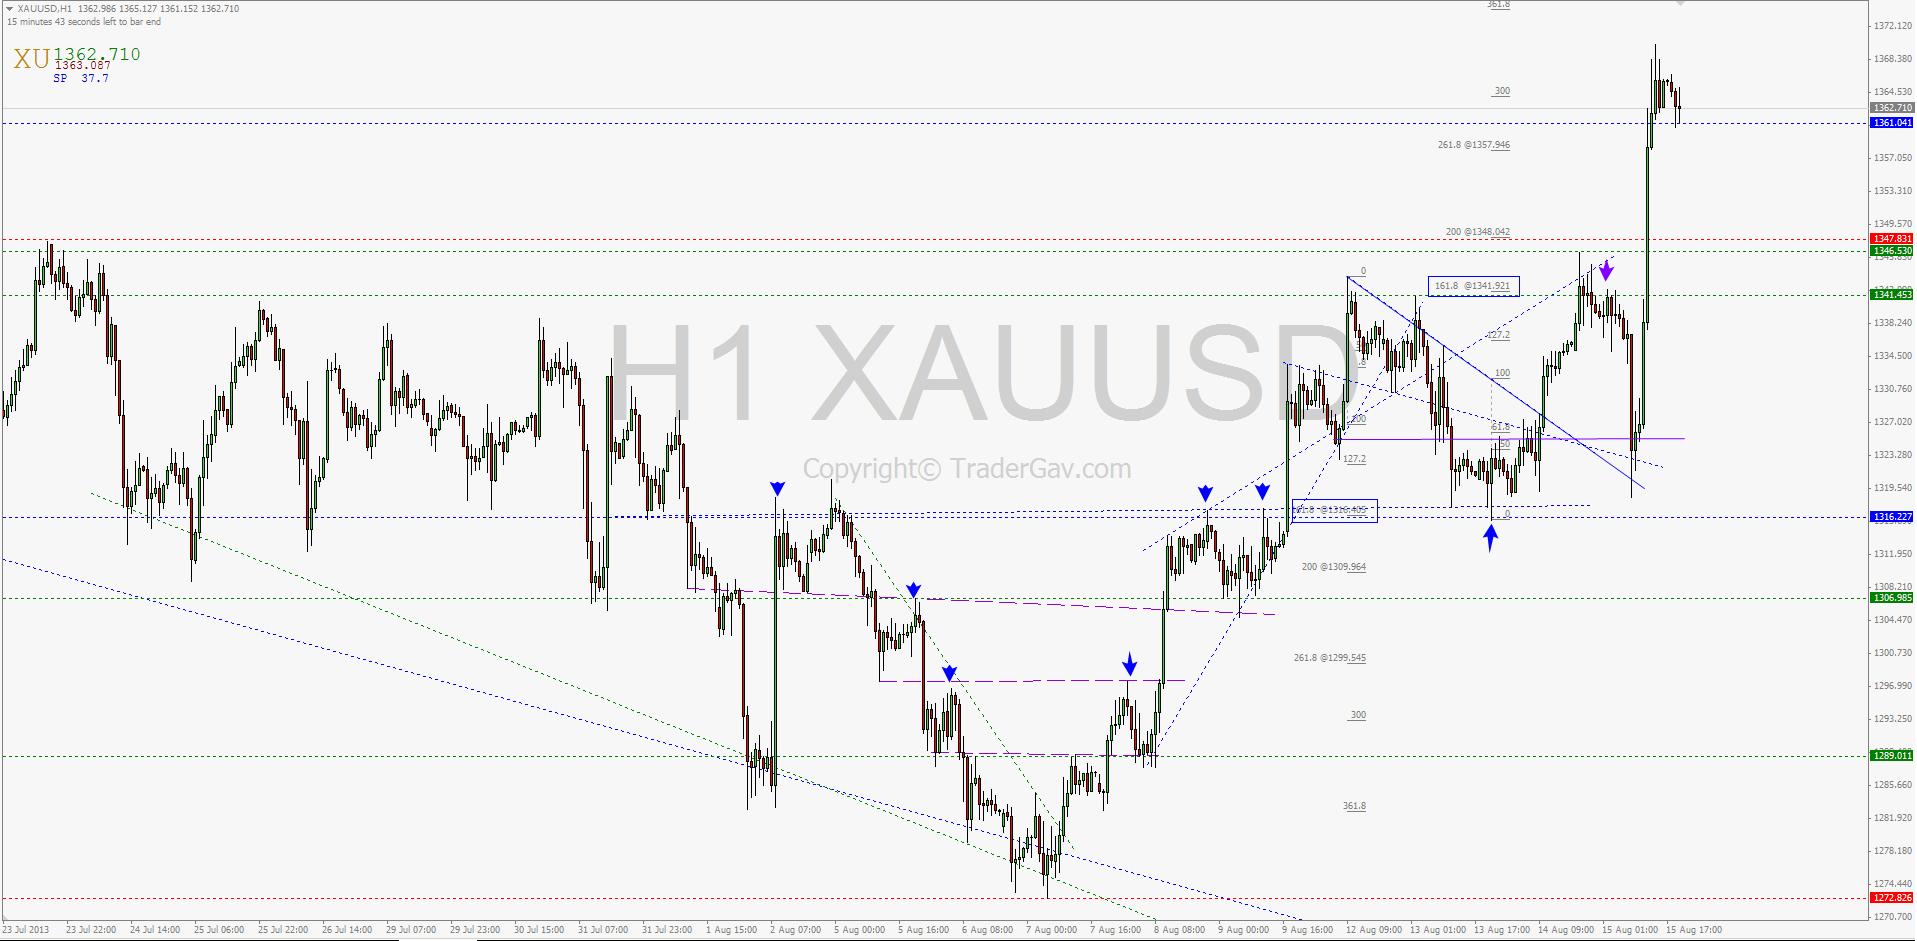
Here is the H1 charts with more detailed trend lines. I won’t go into too much details about the trend lines, probably in other posts. Just to show that there are trading opportunities around the identified support and resistance levels.

That’s it. Just a quick chart review. Hope it helps or at least, the lines did not confuse you.
From the desk of TraderGav.com
RSS Feed migration: Just a quick reminder to those who subscribed to RSS feed of this site prior JULY 2013. I will be switching off Feedburner email delivery this weekend. You should be receiving an email to inform you about new email subscription (via Aweber).
As always,for new visitors, to stay updated with me, please sign up for the free update at the sidebar.


Gav,
Just curious as to why you decided to ditch Feedburner and move to Aweber?