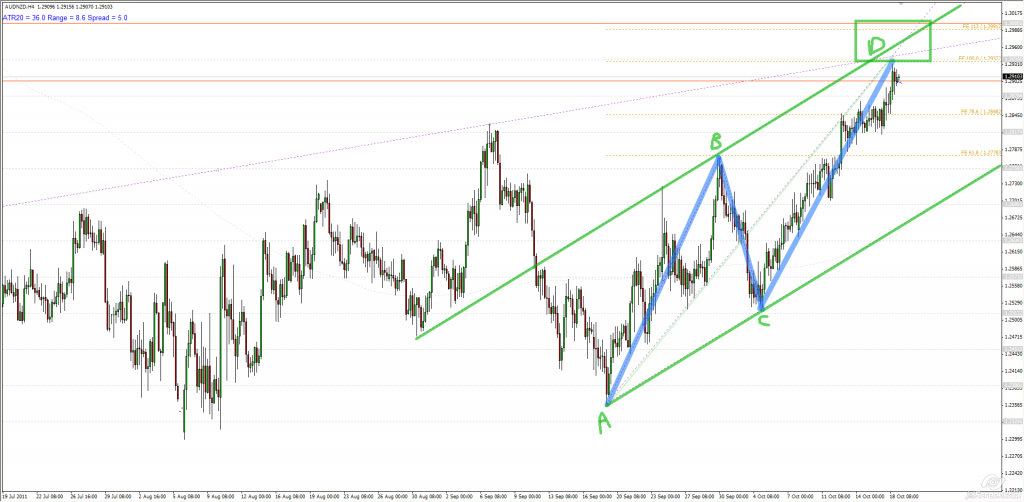
$AUDNZD is approaching resistance level with confluence of harmonic pattern and trend line retest. The risk is the pair might test 1.3 before any significant correction. Let’s see how it works out. Here is the …. CHART!
$EURUSD 13 Oct 2011

I have been stalking a short of EURUSD. (Well, who doesn’t?). However, I prefer to see price pushing a little further before establishing short. Let’s see. As the chart shows, we have confluence of channel, hamornic pattern. And if you notice, it is retesting the previous trend lines. OK, here is the….. CHART!!!!
$GBPUSD 20 September 2011

I was alerted by @NicTrades on twitter about the Bullish Gartley formation in the daily chart of GBPUSD. Here is my chart, with addition trend line retests are observed. Here is the ….. CHART!
$AUDUSD 19 September 2011
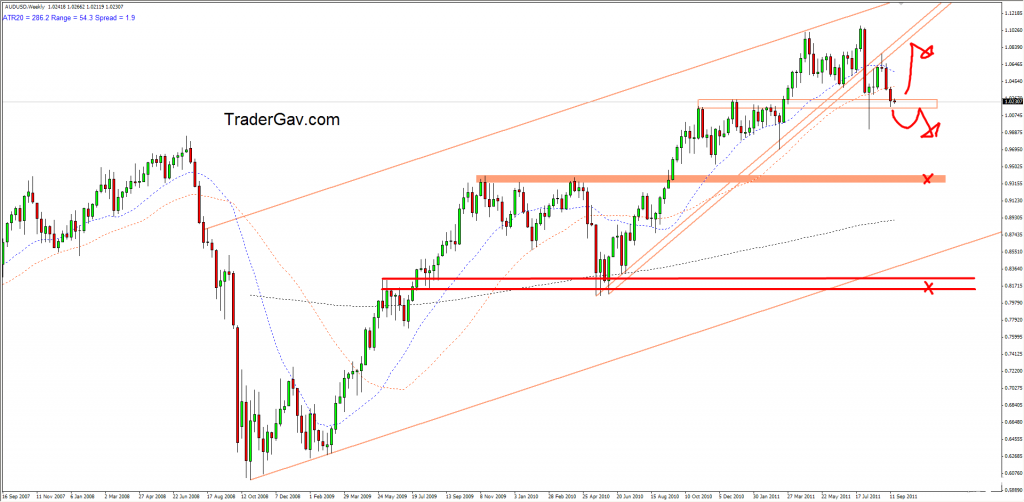
I see AUDUSD sitting at weekly support (OK, I am ignoring the spike happened 6 weeks ago). I would like to see if this level holds. Anyway, this is weekly chart. I am just trying to get a view of big picture. Here is the ….. CHART!
$USDCAD 15 September 2011

USDCAD has been moving within a channel, and now we are sitting at the lower channel band. With the assumption that the channel movement will be continued, I am testing with a small long position from here. First target of long position is the mid pivot of the channel, and upper channel band is the […]
$GBPUSD 07 September 2011

This is a swing trade setup. Cable is moving closer to retest previous broken trend line, and a bullish harmonic pattern is forming. It depends on one’s risk tolerance, I prefer to build entry near trend line. Still watching for now. I expect some reactions at the trend line retest. Here is the … CHART!

