So, we know NFA has been changing rules. Retail traders are complaining, moving away from U.S based brokers. But, is the change really bad? Well, firstly, I am not trying to defence NFA. I am just thinking, should I really look for another European based, or Australian based broker? I am not sure. The change […]
Trading Journal
Updates
I’ve only made a couple of trades early of the week. I generally do not initiate new positions during FOMC, NFP week. So, most of the time, I am just enjoying watching the markets. Meanwhile, I am preparing my travel-trading plan for the coming months. As mentioned before, I’ll be travelling around South East Asia […]
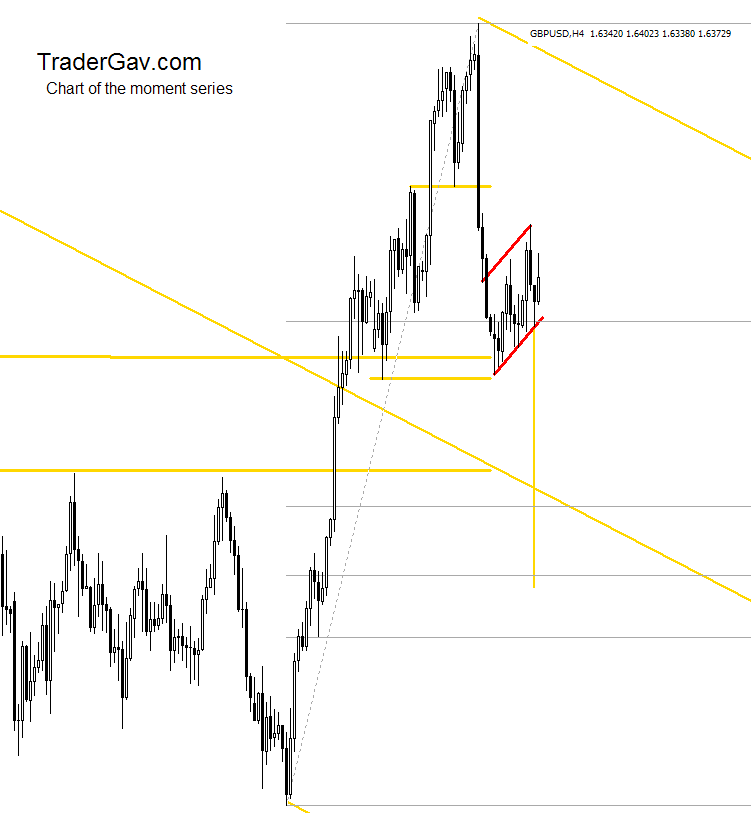
Chart of the moment $GBPUSD 27-Oct-2009
To me, the Cable buying during last session did not change the trend. Instead, I thought there might another opportunity for SHORTs? This is a text book pattern. Nothing fancy, let’s see how it works out. If the the breakout of the pattern realized, I am revising the downside target to around 1.6-ish, still in […]
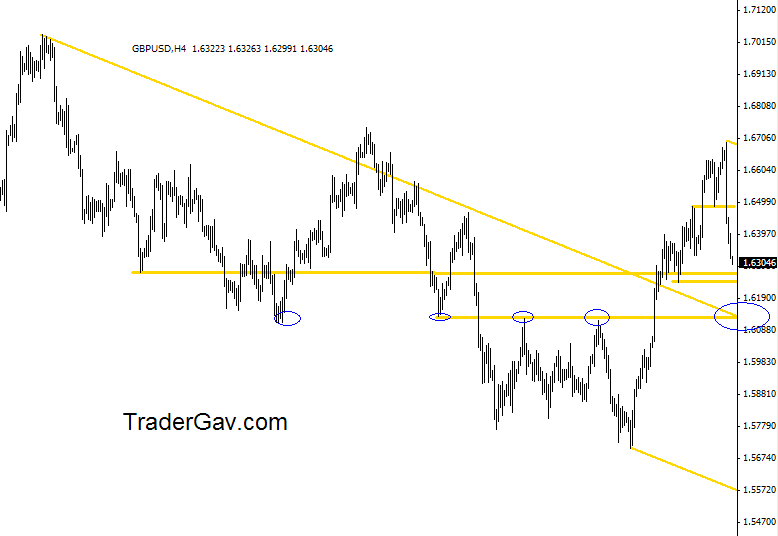
What is your target of $GBPUSD
So how much downside of Cable are we looking at? Well, I am looking at 1.6130-1.6140. Make sense? What do you think? Here is the…. CHART! Some technical statistics here About this tool
Chart of the moment $AUDJPY 23-Oct-2009
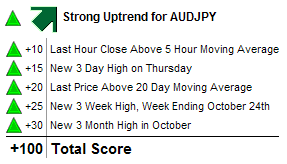
Below are daily chart and hourly chart of AUDJPY. This pair was not in my radar, and thanks to the tweet from BladeTrading. In hourly chart, we have a rising wedge forming, and a 61.8 retracement in daily. So, what do you think? Some technical statistics About this tool
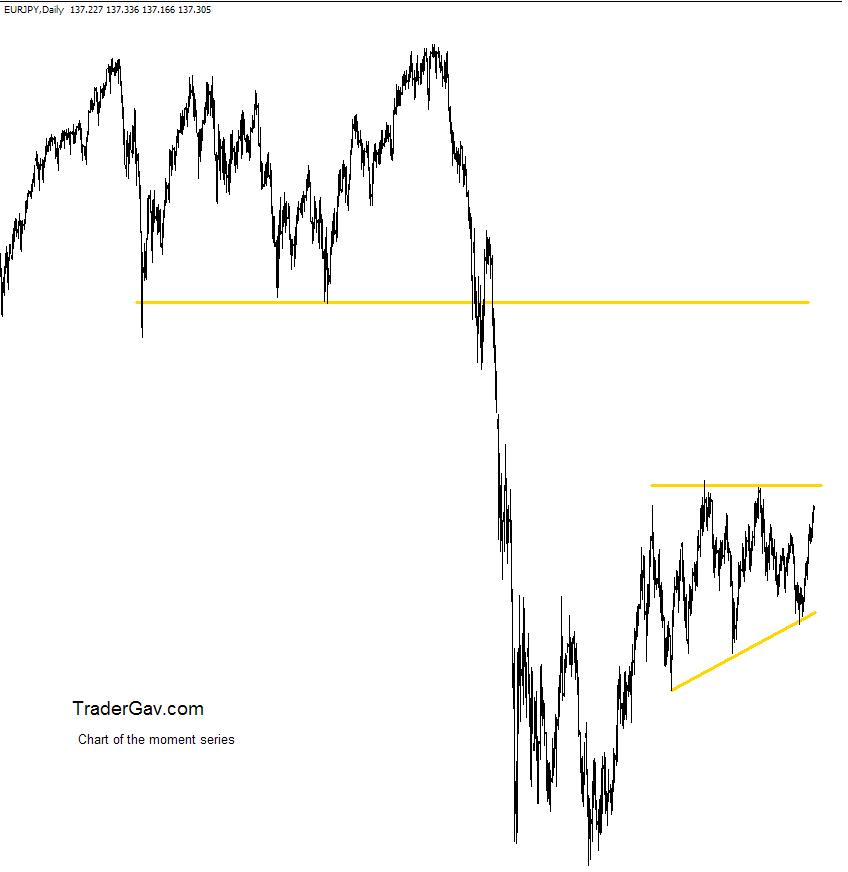
Chart of the moment $EURJPY 23-Oct-2009
This is daily chart of EURJPY. Well, you can say we are heading to a mountain of resistance, or maybe we again, prepare for a breakout? Interesting to follow this development. What do you think? Here is the…. CHART! Some technical statistics :


