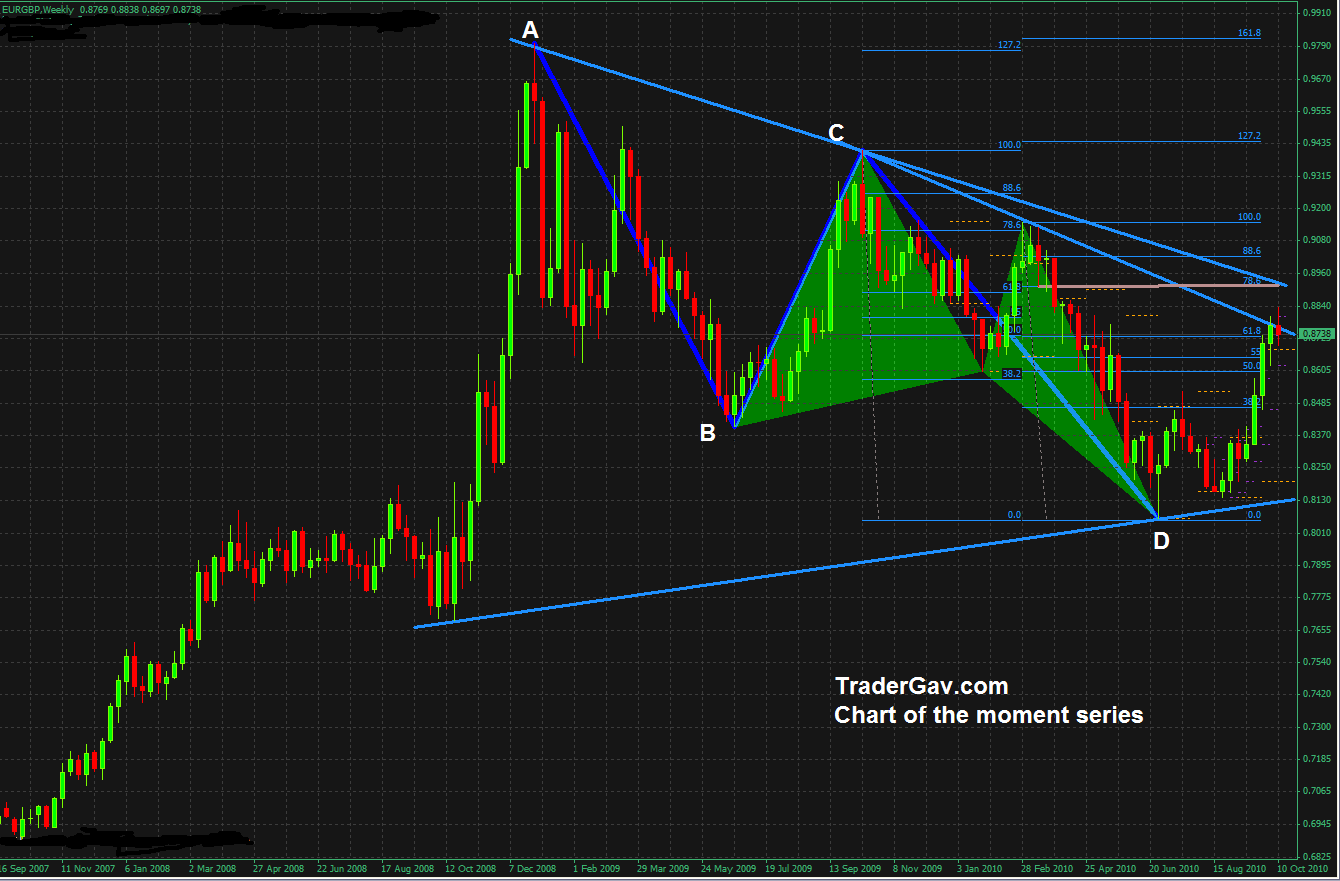
Let’s have a look at the weekly chart of $EURGBP. We have a pennant forming, with ABCD and Bullish Butterfly formations within. It is just so beautiful. I see two possibilities here. First, we might start to have correction right now with 88 level as immediate resistance. Second, we might have another leg and approach […]


