Here are some charts to start the week. There are some other setups forming, but it is impossible to post it all. Anyway,� I thought CADJPY, EURGBP and GBPJPY provide some obvious techincal setups. Have a look. Here are the …. CHARTS!
Key Levels
GOLD 25 September 2012

I think there are probably 10,000 charts talking about the daily “Pin bar” of GOLD lately. I am not the expert of “Pin bar”, I do notice the long tail tested the resistance level and failed to close above it. Anyway, looking into shorter time frame, we have a support zone around 1755. More conservative […]
$AUDUSD 20 September 2012

Here is the 4-hour chart of AUDUSD. Just like last week, everybody was watching/talking about the daily pin bar, now we are presented with a obvious Head and Shoulder formation� in H4 chart.� I like the fact that 1.04 support is now broken, I am looking at further downside. Here is the …. CHART.
$NZDJPY 20 September 2012

Here is the $NZDJPY daily chart after NY session close yesterday. Very nice reaction at 65.50 ish zone. The major roadblock is seen at 64.30 ish zone now. It is a strong support zone formed by previous highs. Here is the…..CHART!
$NZDJPY 13 September 2012
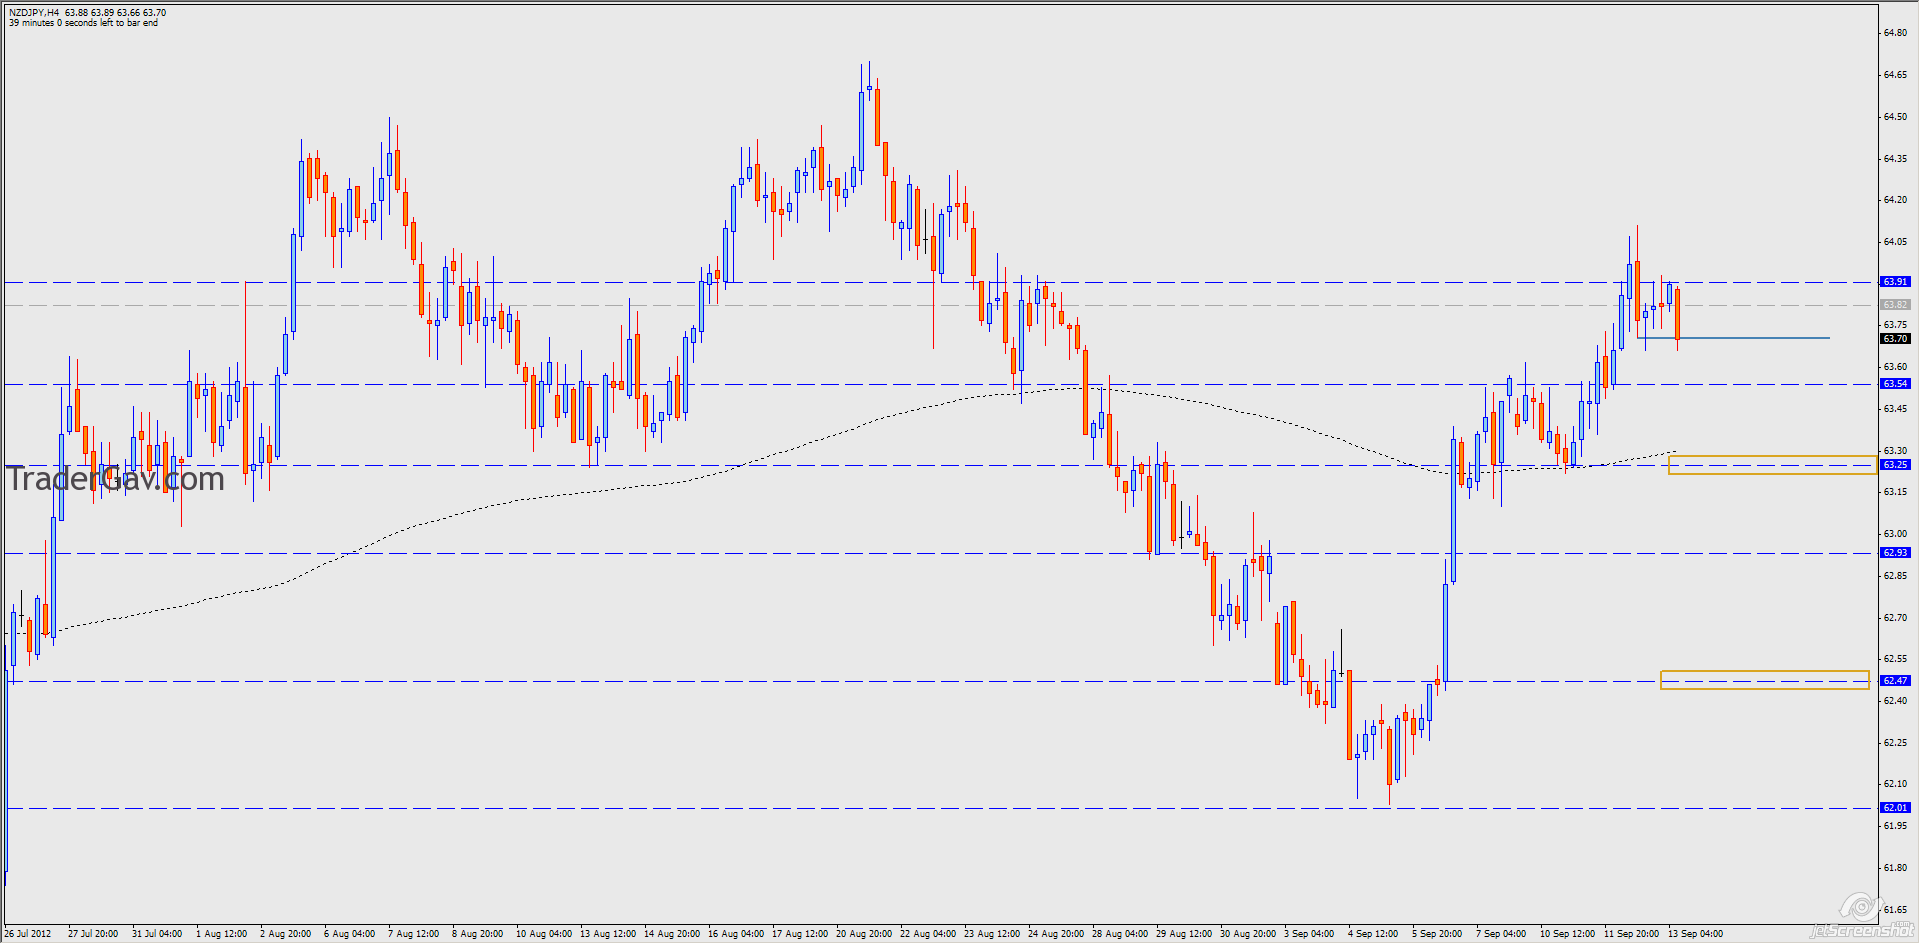
NZDJPY looks interesting to me. A potential short. Just be aware high impact events (FOMC statement) later today.
$EURSGD 12 September 2012

A late post. I was watching potential Long setup of of EURSGD at the retest of previous resistance zone. Initial target is to test 1.59, and next is 1.6. Let’s see how it goes. Here is the ….. CHART!

