• Skip to primary navigation
  • Skip to main content
  • Skip to primary sidebar
  • Skip to footer

TraderGav.com

Gav's trading blog - Perseverance, Consistency, Confidence

  • Home
  • Start Here
    • Back to Basics of Trading
    • Resource For Traders – The Best Tools for Traders
    • Learn Trading Articles
    • Sierra Chart Resource
  • Blog
    • Blog Posts
    • Other learning resource
    • Dummy Collection
    • Harmonic setups
  • About Me

Bearish Gartley

GOLD $GLD 02 Dec 2010

by Gav Leave a Comment

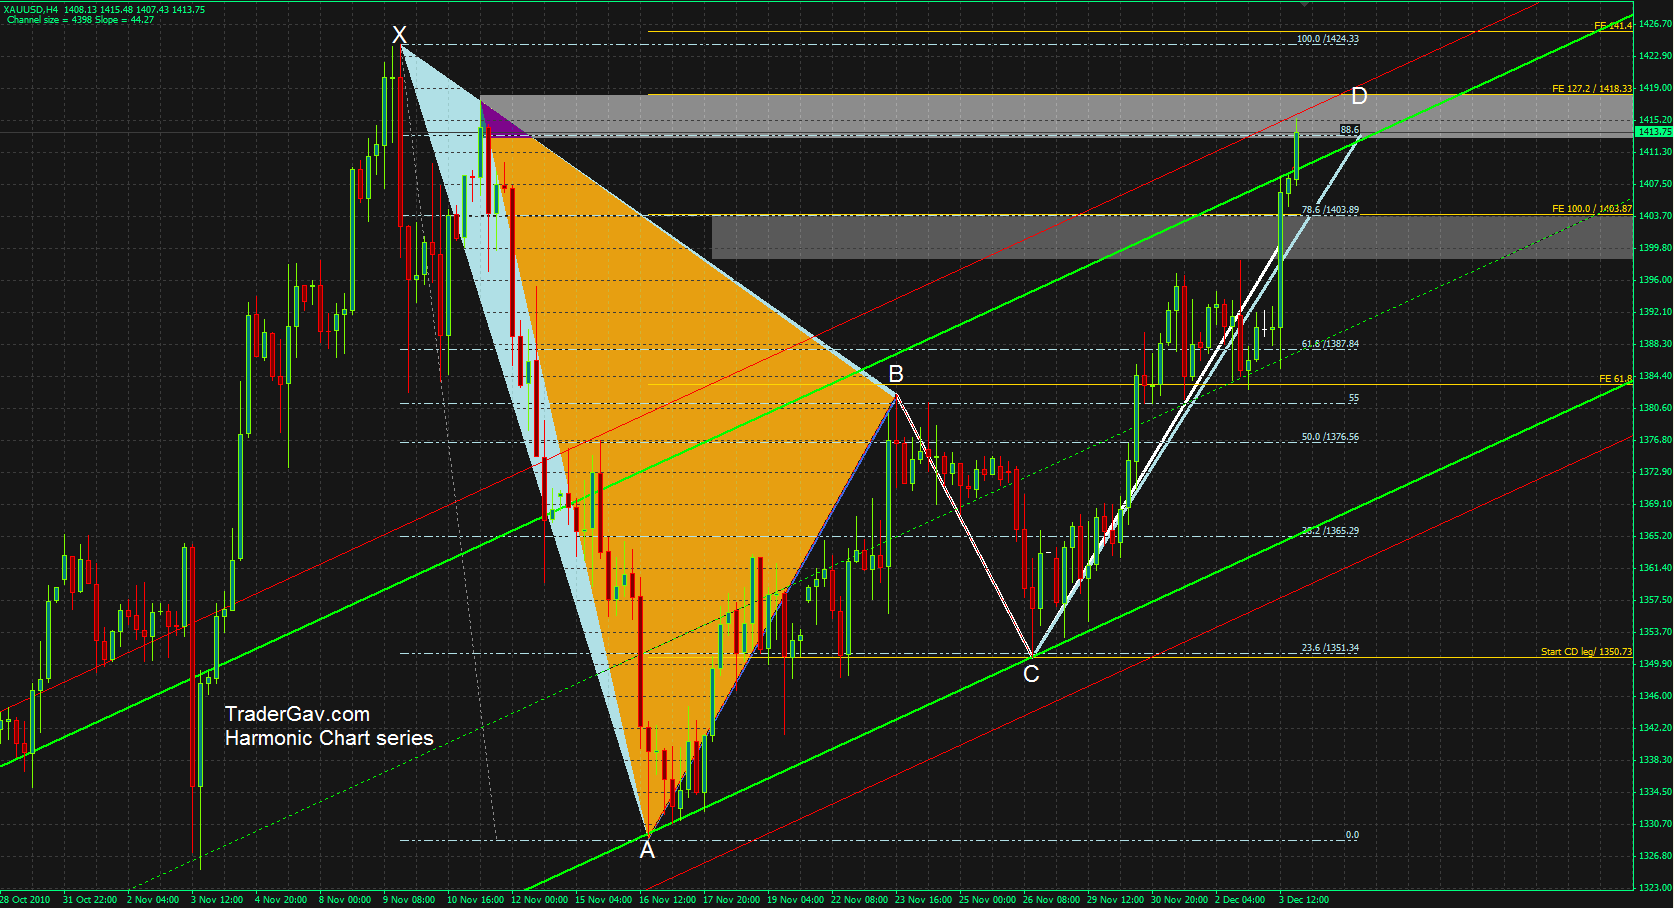
Here is the GOLD chart that I am looking at.  I see confluence of resistance level, channel, Fib levels, and harmonic formation.

I am keen to watch 1400 before deciding if to go short.

[tab: Initial Setup]
Here is the chart…… to confuse you.

$GLD bearish harmonic setup

[tab: Update 05 December 2010]

The initial bearish harmonic setup was invalidated after NFP announcement. GOLD fired through 1400 level. At the Friday close, I observed another bearish harmonic formation. The formation will be invalidated again if ‘X’ is violated.

Here is another chart….to CONFUSE you.

$GLD GOLD Bearish Harmonic setup

Filed Under: Harmonic setups, Trading Journal Tagged With: ABCD, Bearish Gartley, FX, Gold, Trading Journal

$USDCHF 29 Nov 2010

by Gav Leave a Comment

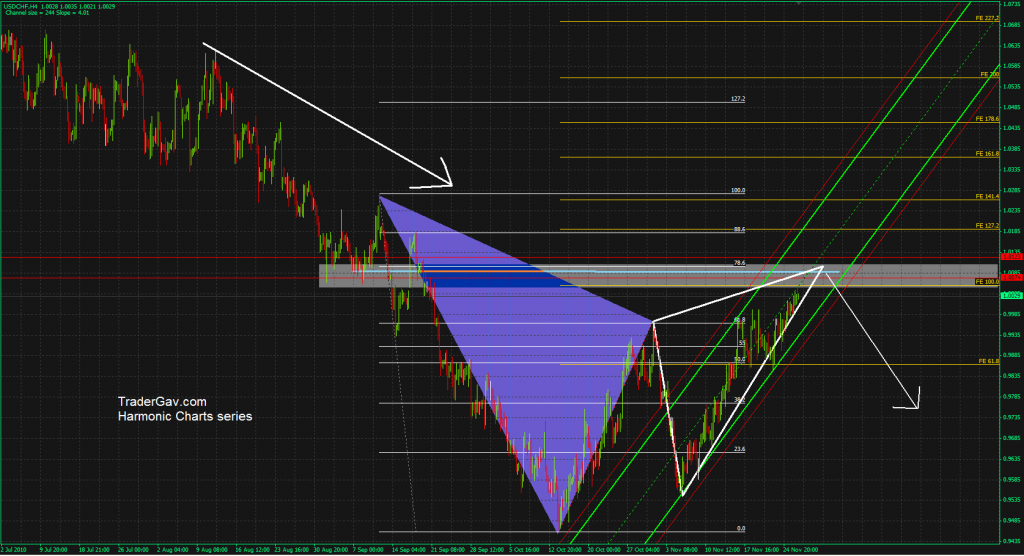
Here is the USDCHF. From technical point of view, it is forming a almost perfect harmonic pattern. Every point hits the target. Well, this doesn’t mean the pattern will work out. However, pattern recognition trading is about providing you a road map, or a window for you (well, at least, for me) to enter the market.

Have a closer look at USDCHF, we are approaching reversal zone, and I see confluence of resistance and Fib levels. Bearish harmonic formation might be signaling the continuation of down trend. Well, let’s see.

Here is the chart to …CONFUSE you.

$USDCHF Bearish Harmonic setup

Filed Under: Harmonic setups, Trading Journal Tagged With: Bearish Gartley, Chart of the moment, FX, Trading Journal, USDCHF

$USDCHF 26 Oct 2010

by Gav Leave a Comment

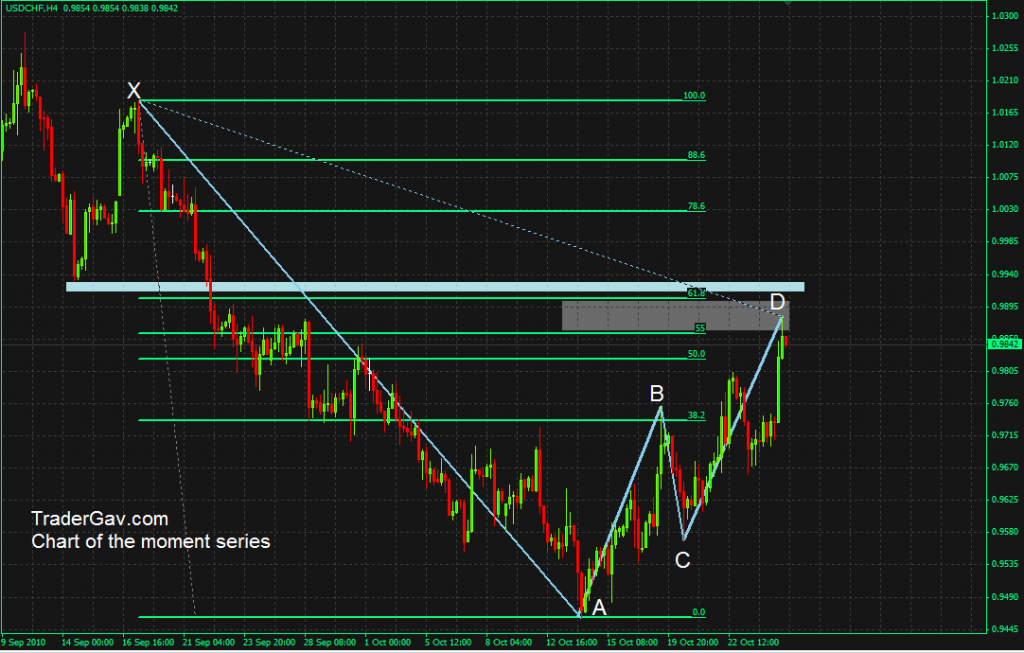
Here is the Swissy chart that I am looking at. I would like to see some price rejections in this zone before establishing short position. Notice the ABCD formation is completed in the resistance zone as well.

Just look at the chart, I am too lazy to write lately. It is really not difficult to recognize a pattern. The key is to manage the trade after recognizing the pattern. We can always have the same patterns/setups, but different set of trading result.

Here is the CHART!

$USDCHF 240min

Filed Under: Harmonic setups, Trading Journal Tagged With: ABCD, Bearish Gartley, Chart of the moment, FX, Trading Journal, USDCHF

  • « Go to Previous Page
  • Page 1
  • Page 2

Primary Sidebar

Best Tools For Traders

Recommend FX Charting

Footer

Recommended FX Charting

Recommended Training

FXSAnalytics
Price Action Course for Professionals

Copyright © 2025 · Affiliate Disclosure · Privacy

We use cookies to ensure that we give you the best experience on our website. If you continue to use this site we will assume that you are happy with it.Ok