Support and Resistance levels are one of the oldest and yet, the most effective methods, to analyze and trade the markets. It is so simple that it is often overlooked by new traders.
It is overlooked because new traders often get attracted by the fancy strategies or indicators.
In this article, let’s have a look at how to draw support resistance levels effectively.
I didn’t invent the strategy, I learned it. I have been trading for over 14 years. And I can’t remember how many books and courses I have read and studied. Everything you read on this blog is the result of years of trading and learning.
The methods might not be original, but they are effective.
Without further ado, let’s move on to look at what support resistance levels are, and how to draw them effectively.
What is the support resistance level?
The textbook definition:
From Technical Analysis of The Financial Markets by John J. Murphy
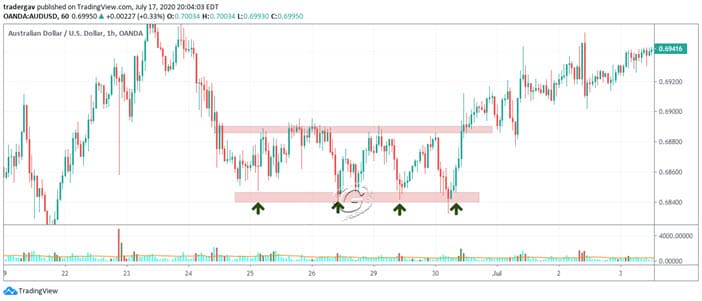
Support is a level or area on the chart under the market where buying interest is sufficiently strong to overcome selling pressure.
Technical Analysis of The Financial Markets by John J. Murphy
Visually, think about the price levels that the market repeatedly tests or the level with multiple swing lows. That’s where the market finds support.
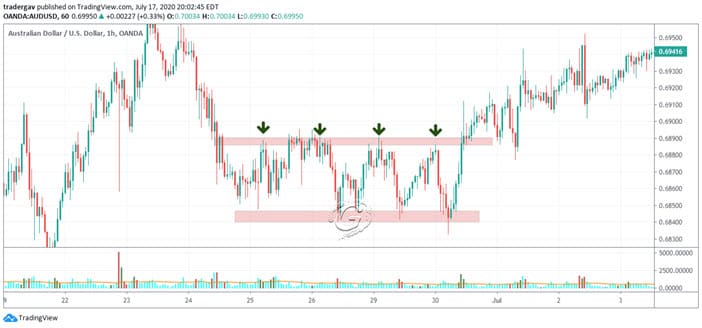
Resistance is the opposite of support. It is a level or area over the market. Selling pressure overcomes buying pressure here. A price advance is turned back.
Technical Analysis of The Financial Markets by John J. Murphy
(But hold on, it does not mean you should trade at this level just yet, keep reading)
These are the text-book definition of support and resistance. But that is not what I would use to trade.
But they said Support and Resistance is a zone
Yes, that’s not wrong.
I prefer to start looking for a level and expand around it to construct a small zone.
In this post, I will focus on looking for a high probability level.
When I draw support resistance levels, there are few guidelines I follow. There are no hard rules. The more you practice, the more you will learn.
In general, I found these guidelines are pretty effective.
When drawing a support resistance level, start from a higher time frame, and working down to the lower time frame.
Don’t waste too much time on the “muddy” area. Always look for the obvious. Focus on the clean levels.
Guidelines to draw support and resistance levels
- #1 The more touches a level has had, the more significant the level is.
- #2 The longer a level is held, the more significant it is when it is broken.
- #3 The more times a level is tested, the weaker it becomes. It is more likely to be broken.
- #4 The inverse support or resistance levels are the ideal trade locations
- #5 Look for an inverse level that was tested multiple times before it was broken.
- #6 Focus on recent price actions and work your way to the left
#1 The more touches a level has had, the more significant the level is.
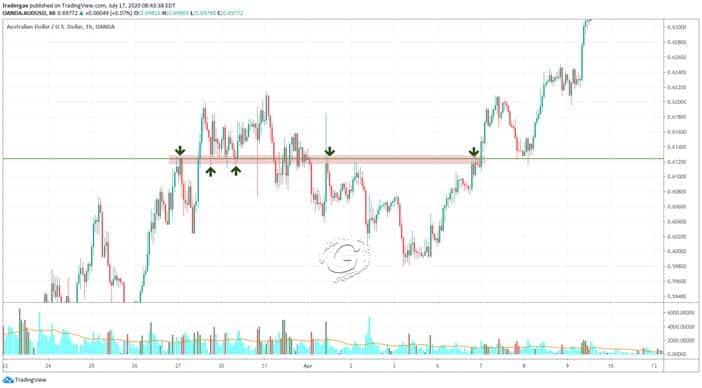
A price level that the market respects and reacts serves as a good support resistance level. Use this as one of the factors when drawing a level.
#2 The longer a level is held, the more significant it is when it is broken.
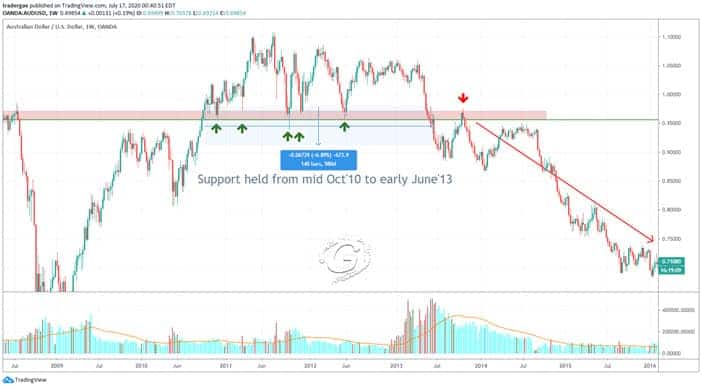
Similar to point 1, when a support or resistance level holds up the market for a long time, it is significant. The market respects it.
When it is broken, it signals the major change of sentiment, and it serves as an excellent trade location.
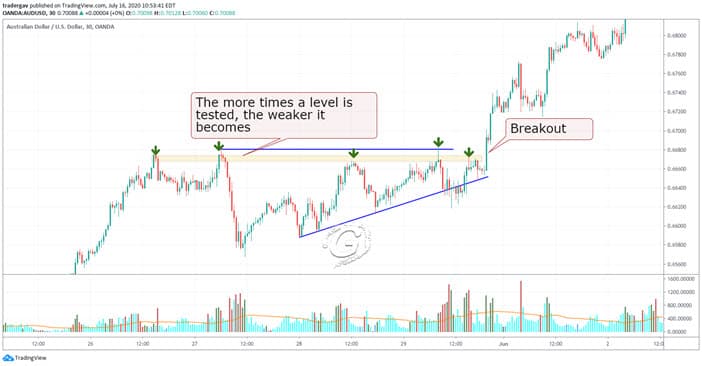
#3 The more times a level is tested, the weaker it becomes. It is more likely to be broken.
Surprised?!?
The old wisdom taught us, the frequently tested level shows strength. The truth might be just the opposite.
Let’s put it this way:
A support level holds up a price because there are buying orders waiting. The orders could be from any sources. Be it bank, retail, or institutions.
However, when the same level has been tested multiple times, the orders are filled and eventually will dry out.
What will happen when there is no more buy order to hold up the price? Where do you think the market will go now? It tanks.
The same principle applies to resistance levels.
The more time a resistance level is tested, the selling pressure (the sell orders) at the price level is consumed and reduced.
When the sell orders are drying out, breakout happens. The market continues moving up until selling orders appear.
As a guide, I keep a rule of two-touches:
I only trade at the first and second touches of a support or resistance level. After the first two touches, I will wait for the break of that level to decide the next action.
#4 The inverse support or resistance levels are the ideal trade locations
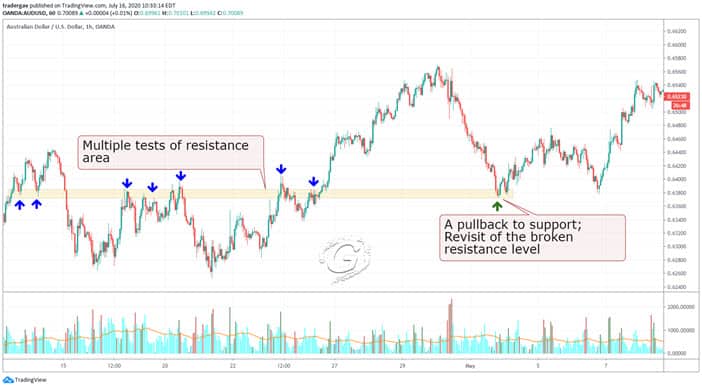
What do I mean by “Inverse Level”?
Inverse support is a broken support level. It becomes a resistance when the market revisits the level.
Inverse resistance is a broken resistance level. It becomes support when the market revisits the level.
When a level is broken, it signals a change of sentiment. It shifts the willingness of buying or selling.
Let’s take a support level as an example. When a support level is broken, it signals the selling pressure overtakes buying pressure. In other words, there is a new willingness to sell.
When the market revisits the same level, it is likely to find resistance at the level.
How to decide which inverse level to trade? This brings us to the next point.
#5 Look for an inverse level that was tested multiple times before it was broken.
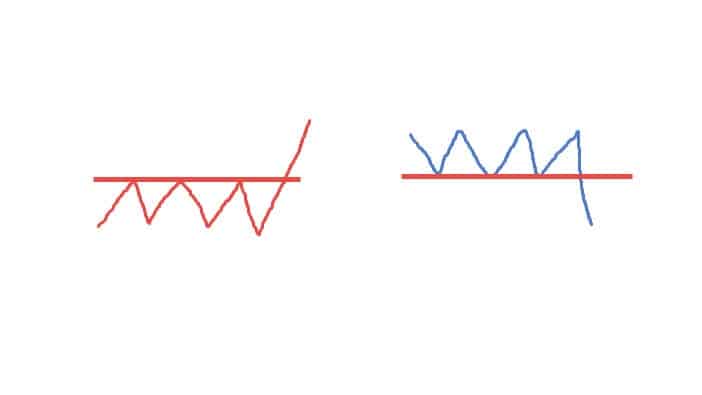
The more times a support level is tested, the stronger the inverse level will be.
When a support level is tested multiple times, buy orders are filled. It takes a lot to break a strong support level. Eventually, selling pressure overtakes the buying, the support level is broken.
There are now more selling interests below this level. It now serves as a strong resistance level.
The same rule applies to a resistance level.
To define a good inverse level, I apply a rule of two-touches:
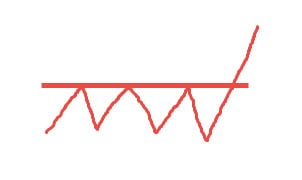
When looking for a support level, I prefer a broken resistance level with at least 2 touches before the breakup.
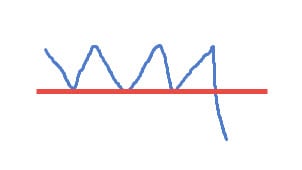
When looking for resistance level, I prefer a broken support level with at least 2 touches before the breakdown.
#6 Focus on recent price action and work your way to the left
Some traders like to go as far as they can to draw levels based on historical swing points. Well, they might be right, but that’s not what I would do.
I am a short term trader. I focus on the most recent price structure because that is what the market is “thinking” right now.
I put more weight on the recent swing points when drawing support and resistance levels. It could be days or weeks. I won’t go back years of data to draw levels from there.
Try Tradingview Pro Charting Platform For 30 days
Tradingview is my go-to FX charting and trading solution. I have done extensive coding and trading on the platform. I am happy to recommend them.
If you are interested in using Tradingview, you can try out the Pro membership FREE for 30 days. This is an excellent time to check out the powerful features of Tradingview charting.
How to draw Support Resistance levels – Final words
Support and Resistance levels are one of the many ways you can use to look at the market. It has been used by professionals, but there are also many of them that do not use it. It is not a holy grail.
Trade Location + Entry + Execution + Management
Secondly, support and resistance levels are used as trade locations. That’s just one piece of the trading puzzles. The next step is to work on your entry method, execution, and finally management.
If you are looking for an example on how to use support resistance levels, I wrote a short blog post about using Support Resistance levels to manage your exist strategy.
Thoughts
Let me “destroy” your dream before we finish up this post. If you are constantly looking for some rules you can follow and start making money, you will be disappointed.
There are no exact rules you can follow in trading.
It is always through discovery and testing. Failures after failures. And maybe, more failures. You need to find a methodology that fits you.
Having said that, study and improve your skills in identifying support and resistance levels give you a good head start.
Alright, this post is longer than I expected. Hopefully, I offer something useful.
Tools For Traders
All charts posted on this article are prepared using TradingView. TradingView is my recommended Forex charting platform. It is web-based, stable, and offer a great range of market data. It offers both free and paid plans.
If you are interested in learning more about the tools I used in my daily trading business, check out the resource page here.
Do you have any questions or comments? Feel free to drop me a line in the comment section. I am happy to help.


Leave a Reply