• Skip to primary navigation
  • Skip to main content
  • Skip to primary sidebar
  • Skip to footer

TraderGav.com

Gav's trading blog - Perseverance, Consistency, Confidence

  • Home
  • Start Here
    • Back to Basics of Trading
    • Resource For Traders – The Best Tools for Traders
    • Learn Trading Articles
    • Sierra Chart Resource
  • Blog
    • Blog Posts
    • Other learning resource
    • Dummy Collection
    • Harmonic setups
  • About Me

Support Resistance

$AUDUSD recap 17 November 2015

by Gav Leave a Comment

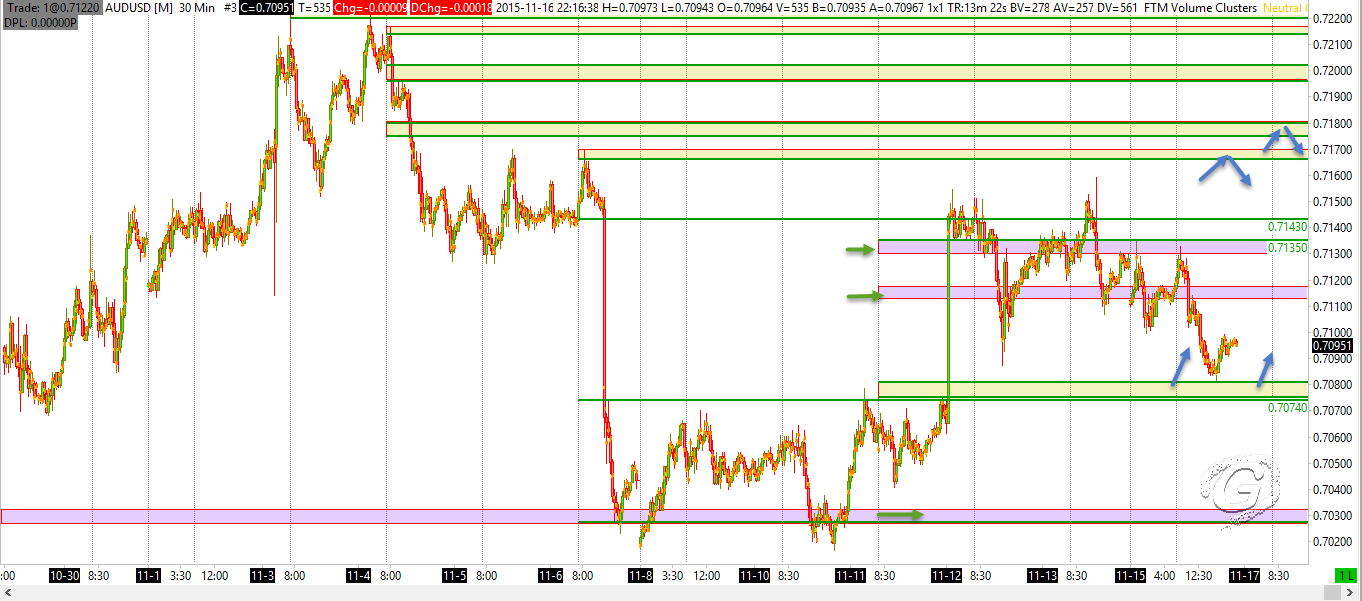
Yesterday, I tweeted about $AUDUSD ‘s structure prepare. Here is the updated chart. I expected market to fill the single prints between 7074 and 7143.


$AUDUSD looking at the potential of repairing the structure between 7074/7143

— Gavin (@tradergav) Nov. 16 at 11:13 AM

Updated chart

Chart prepared using Sierra Chart.

Looking ahead, here are some zones I am watching to do business.

60m

Filed Under: Chart of the moment, headline post, Support Resistance, Trading Journal

GBPUSD trade the obvious?

by Gav

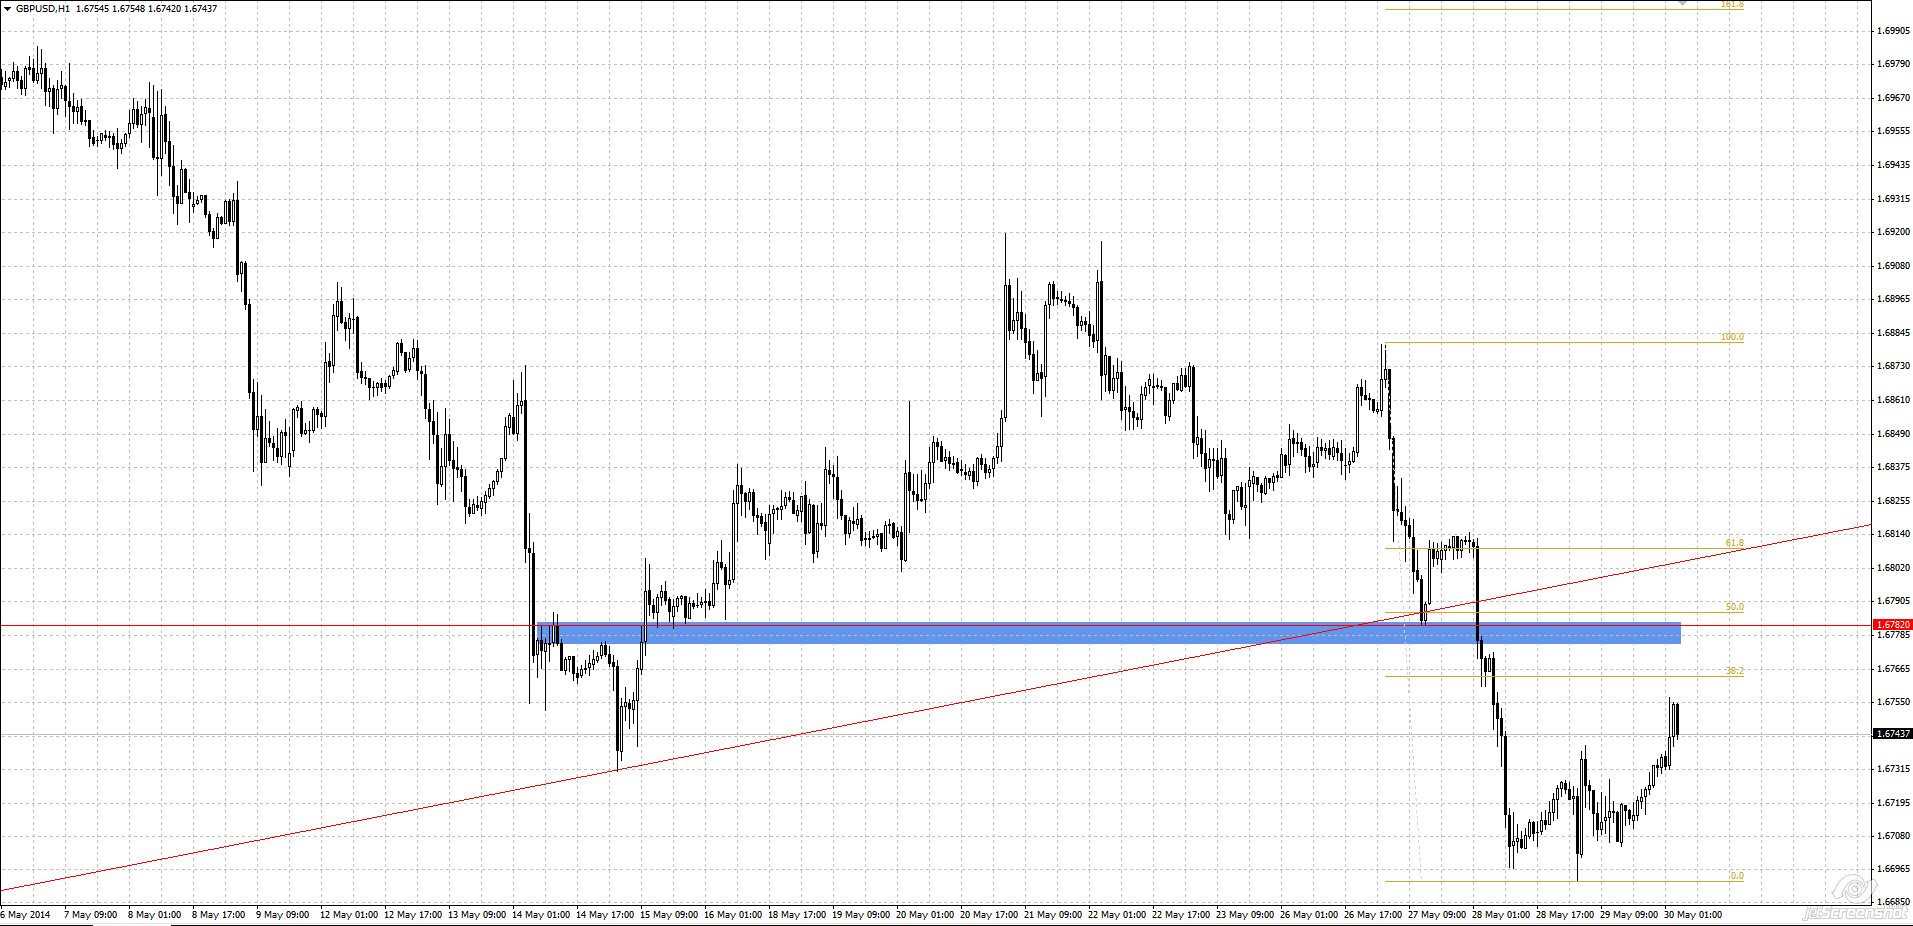
Just thought I would post a chart here. This is a text book style support-resistance setup. Trade the obvious?

Have a look at larger time frame to set your bias. This setup might be provide you a good entry.

GBPUSD Hourly
GBPUSD Hourly

Filed Under: headline post, Support Resistance, Trading Journal Tagged With: GBPUSD

FX charts for week 21 Oct 2013

by Gav Leave a Comment

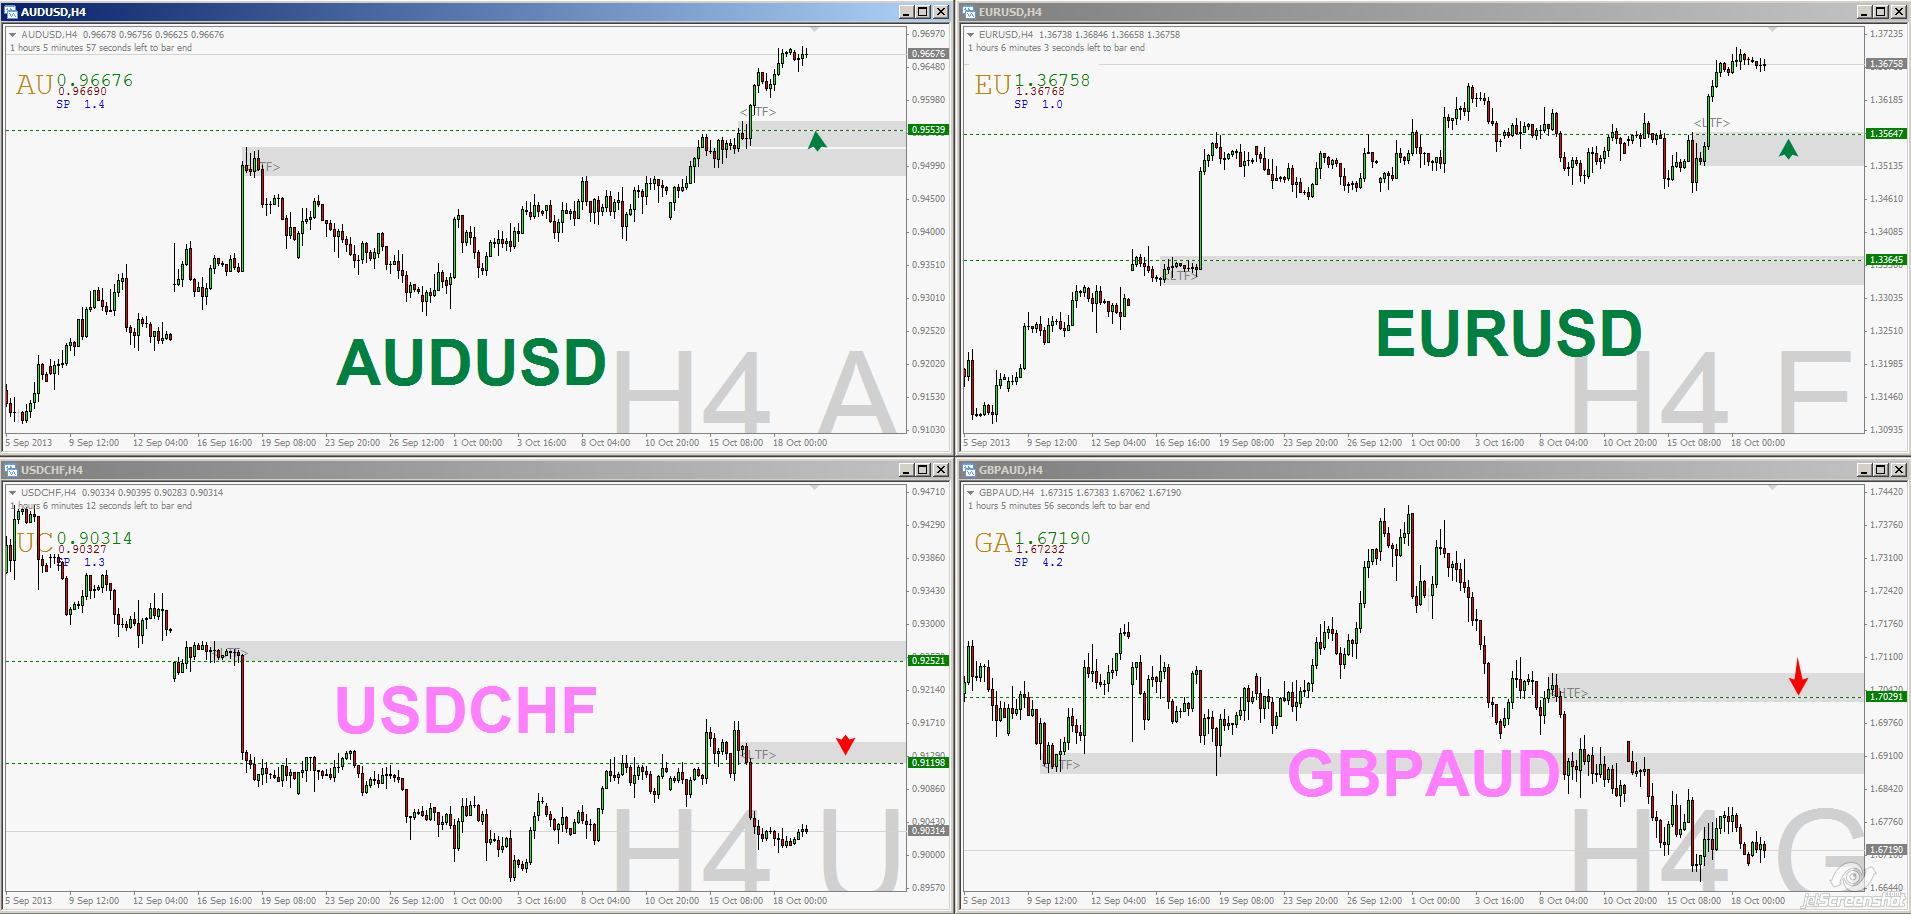
While  my  main focus is in Futures trading, I am still keep an eye  on spot FX for swing trading ideas. Just thought I would share some FX charts which I am watching.

I hope these charts help. You can always click on the charts to view in original size.

AUDUSD:

Still looking at buy on dips.

AUDUSD H4
AUDUSD H4

EURUSD:

Looking to buy at dips

EURUSD H4
EURUSD H4

USDCHF

Looking at potential short around 0.9120

USDCHF H4
USDCHF H

GBPAUD

Looking at potential short around 1.7030

GBPAUD H4
GBPAUD H4

Filed Under: headline post, Support Resistance, Trading Journal

Weekly Review of spot GOLD (XAUUSD) 16 AUG 2013

by Gav 1 Comment

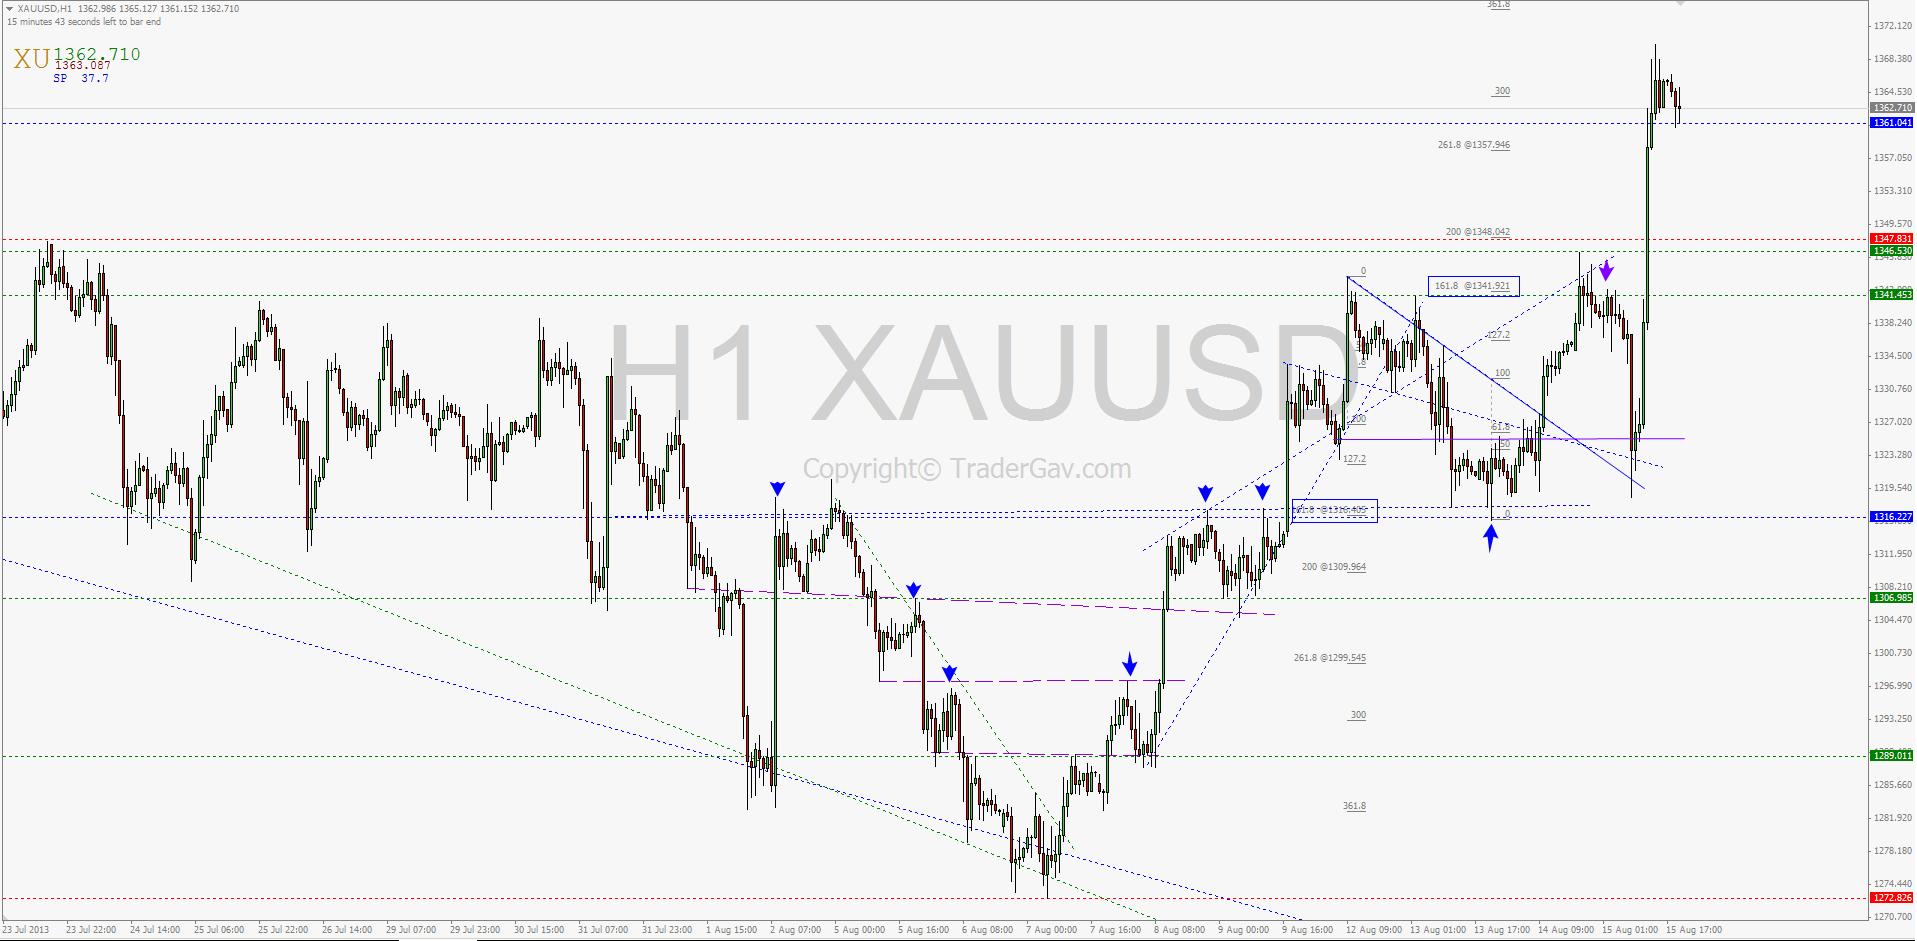
Here is the quick chart review of spot GOLD XAUUSD.  You can also find last week’s chart review here.

The best way to understand the movement is to look at the charts in multiple time frame. The charts basically explain everything. I will just try to give brief descriptions.

On Thursday, Gold broke away from  resistance level 1347.83, the immediate target is seen at 1392/98.

Here is the Daily Chart with key levels marked.

spot GOLD Daily chart

Looking into 4-hour time frame, we can find some details about the price movement. Last week, we saw the break of down trend line, and also the resistance level around 1316.22. The best opportunity,and more conservative way to enter a long trade is to wait for the pull back to the broken resistance level. As shown in the chart, price respected the level 1316.22, and made another run to the upside after retesting the level.

Here is the 4-hour chart with key levels marked.

spot GOLD XAUUSD 4-hour chart

Here is the H1 charts with more detailed trend lines. I won’t go into too much details about the trend lines, probably in other posts.  Just to show that there are trading opportunities around the identified support and resistance levels.

spot GOLD XAUUSD 1-hour chart

That’s it. Just a quick  chart review. Hope it helps or at least, the lines did not confuse you.

From the desk of TraderGav.com


RSS Feed migration: Just a quick reminder to those who subscribed to RSS feed of this site prior JULY 2013. I will be switching off Feedburner email delivery this weekend. You should be receiving an email to inform you about new email subscription (via Aweber).

As always,for new visitors, to stay updated with me, please sign up for the free update at the sidebar.


Filed Under: headline post, Support Resistance, Trading Journal

One USDJPY trade 12 August 2013

by Gav Leave a Comment

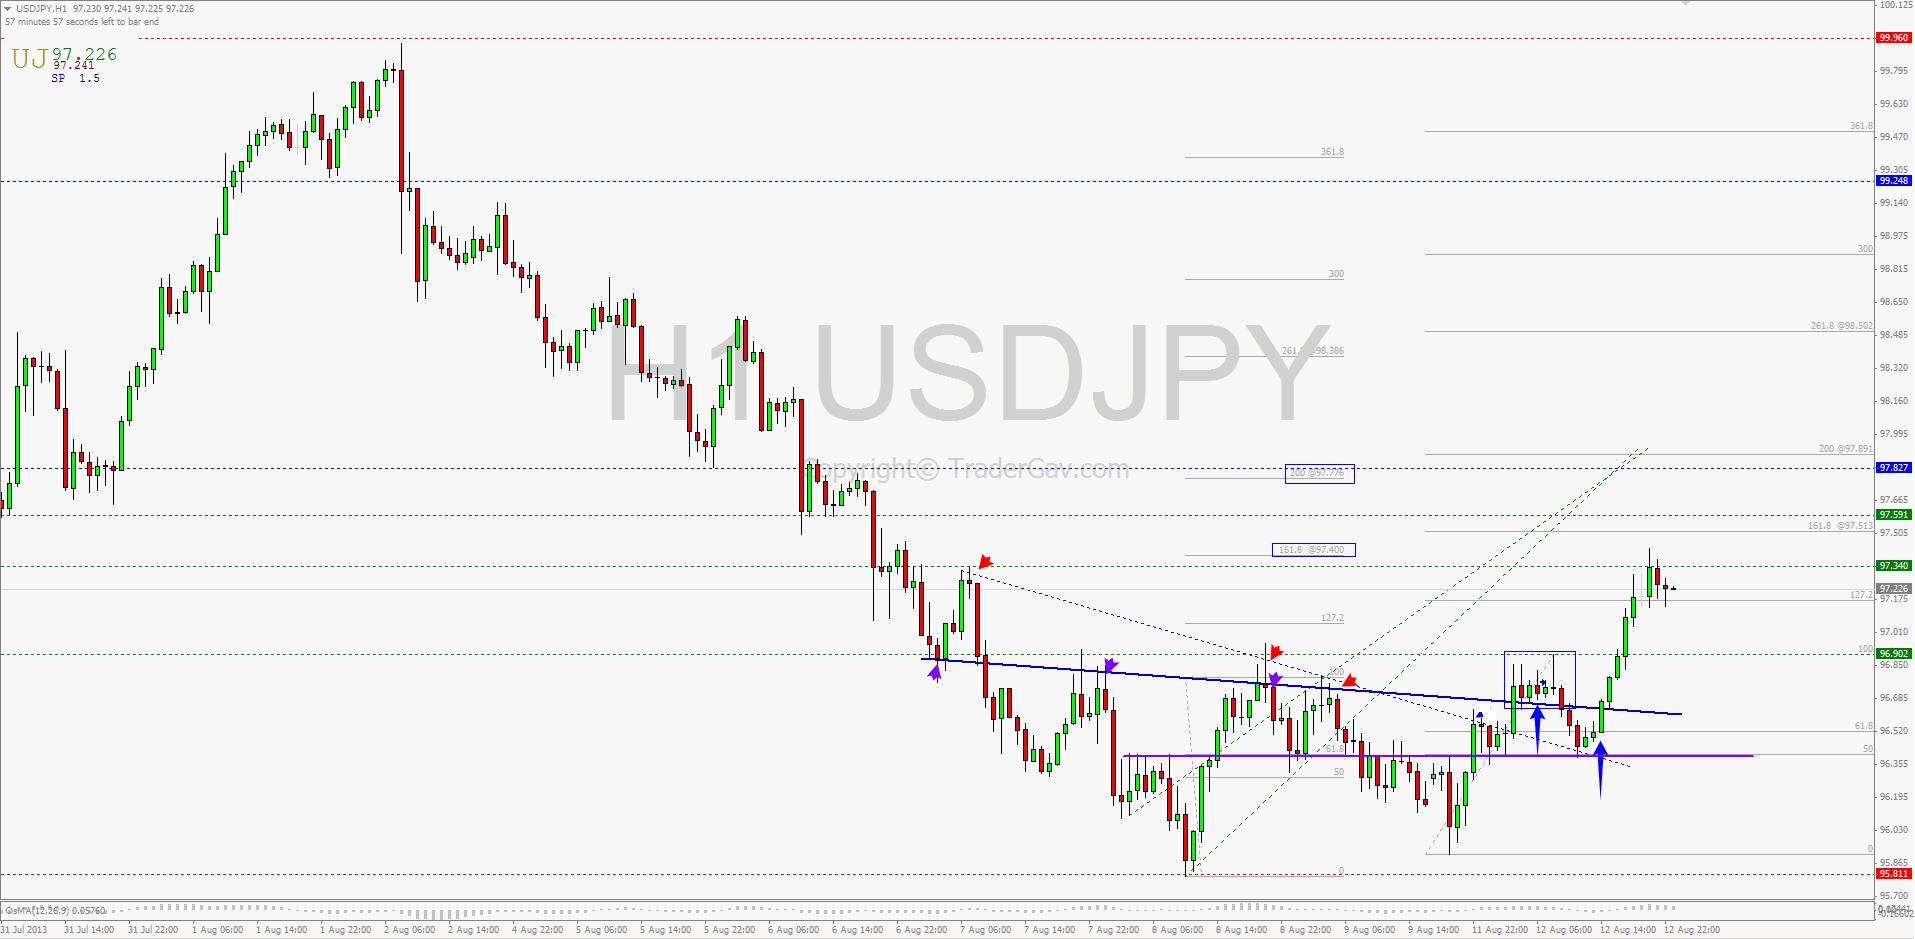
Just a quick post of one of the trades I made yesterday. I thought it might provide some educational value to my now 13 readers.

I went long of USDJPY around mid London session yesterday. My entry was not the best I would like to have.  I saw a small consolidation cluster around 96.75 , and it, in fact, broke the inner trend line. (Refer to the blue bold line in the chart below).  My view was, the consolidation above inner trend line might potentially be a launch pad for a upward movement.  Well, it dipped a couples of hours later, but never go beyond 50% retracement of the current swing. Stop loss was not triggered.

In retrospect, the dipped after my entry was indeed a retest of another broken down trend line and support level. In hindsight, this is a better entry, but hey,that’s trading, and everything looks better in hindsight, no?

Target is set at 97.40. This is the price projection measured by using the Fibonacci extension of 161.8, golden ratio, of the lowest swing low to the break of inner trend line.  The target was achieved during Tuesday Asian morning session.

2nd target is set at measured move up to around 97.80 which is also a resistance level.

Here is the 1-hour chart of USDJPY.

USDJPY 1-hour chart
USDJPY 1-hour chart

I suggest to have a look at Steve’s NBT posts for the concepts of price projections for target setting.

That’s it for now. Have a good trading week ahead!

From the desk of TraderGav.com

Filed Under: headline post, Support Resistance, Trading Journal

Levels trading tips from hindsight analysis

by Gav Leave a Comment

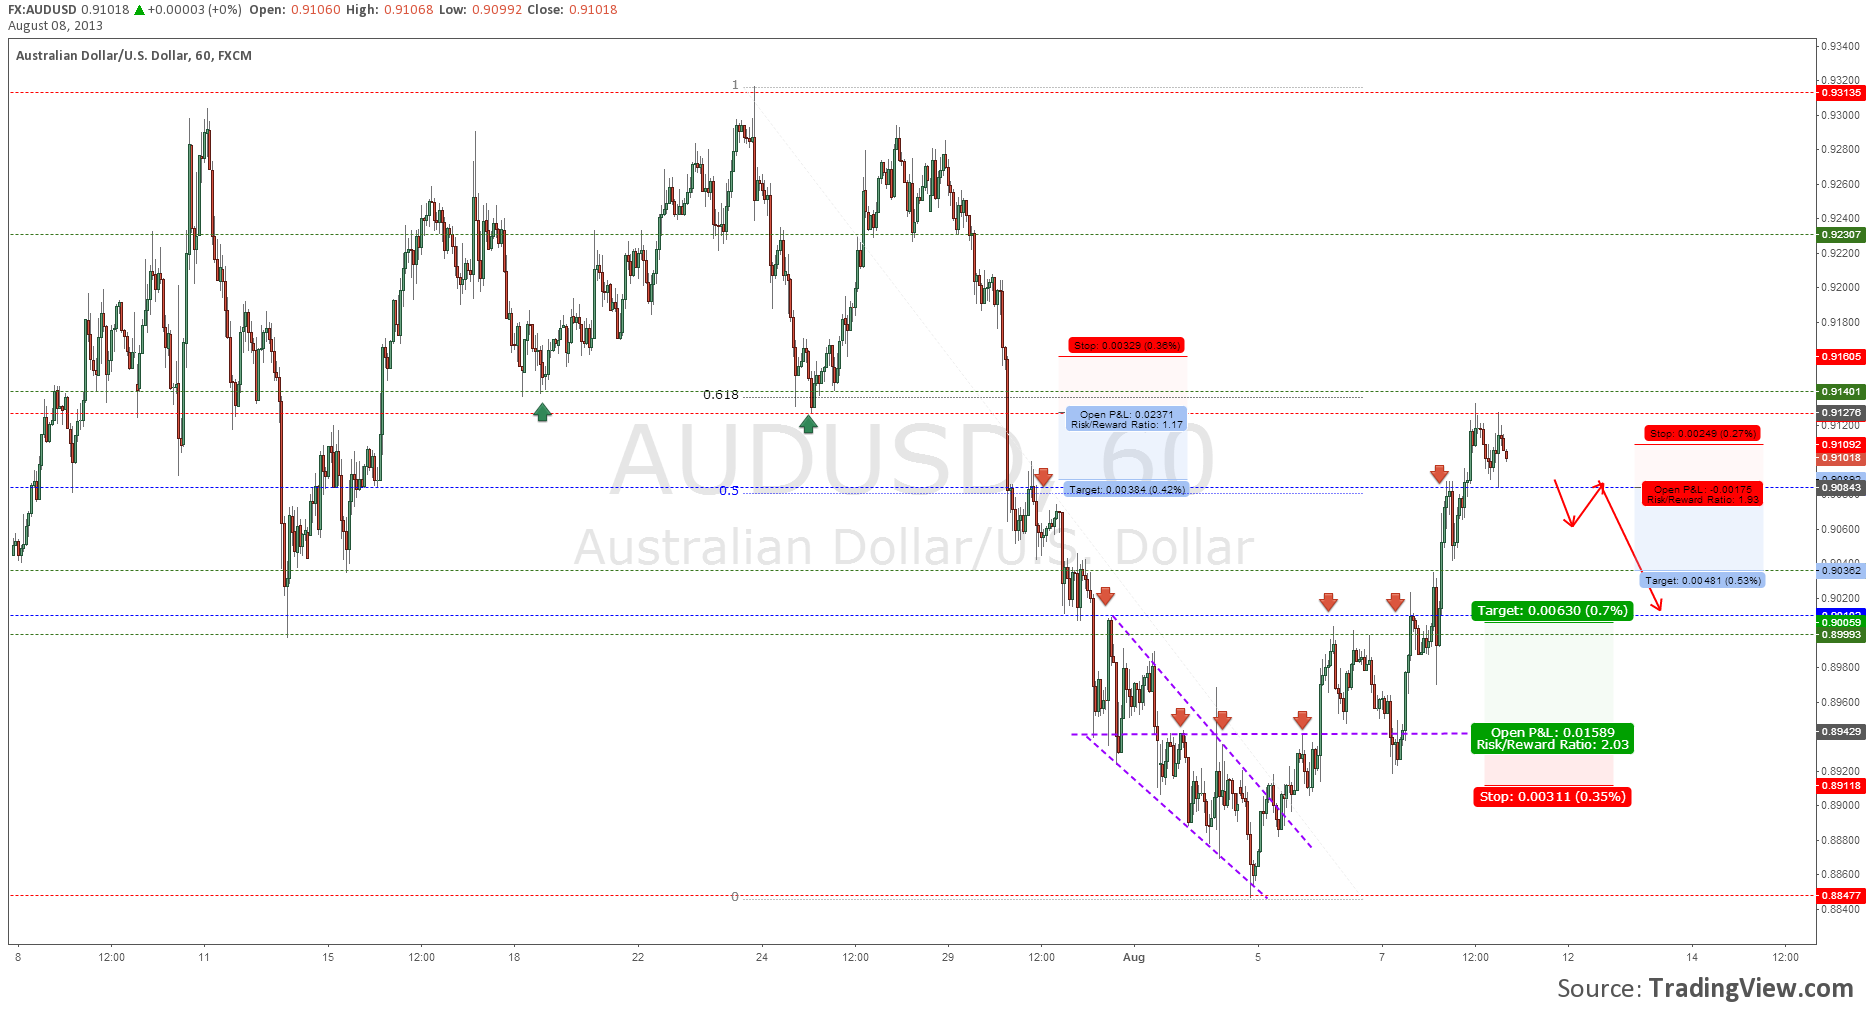
First of all, AUDUSD approached 0.9130/40 resistance level. This is a daily level, and price reacted and immediately pulled back to intraday (hourly) support level 0.9085. If you managed to get in short position at the first test of 9130 level, the setup should give you around 1 R at 0.9085. (Unless you used a ridiculous tight stop, then you might get more of it..but, heck, it doesn’t make too much sense to me)

Here is the hour chart of AUDUSD

AUDUSD 1-hour chart 09 August 2013

In case you’ve missed the first train of selling, I would prefer to wait for the break of 9085 and enter at the pull back to this level. It can be a rounded retest or immediate retest (read my butt kiss setup).

In addition, if you  noticed starting from mid-0.89 down to mid-0.88  there was an accumulation/distribution pattern, and also can bee seen as  multiple taps formation. Refer to the purple dash lines in the chart. 0.8943 was the decision level for this pattern, once it was broken, pull back to this level provided a valid long entry. With target set at slightly above 90 cents, it provided 1:2 risk reward ratio.

Our good friend, Steve at NoBrainertrades.com wrote an awesome blog post yesterday The Decision Making Plan – An Alternative Process to Trade Entry. In his PREP decision making process, the 1st action before starting a position is to identify profit target, identify where we are getting out of the trade. It makes total sense to me. Spend some time and read it.

We know price will normally react at the level, but the question is always, how far will it go. So, it is important to know where to enter a trade, it is even more important to have price projection, i.e where do you expect price to reach from here.

Hope you have a great week so far.

From the desk of TraderGav.com

Filed Under: blogs, Support Resistance, Trading Journal

  • « Go to Previous Page
  • Page 1
  • Page 2
  • Page 3
  • Page 4
  • Interim pages omitted …
  • Page 8
  • Go to Next Page »

Primary Sidebar

Best Tools For Traders

Recommend FX Charting

Footer

Recommended FX Charting

Recommended Training

FXSAnalytics
Price Action Course for Professionals

Copyright © 2025 · Affiliate Disclosure · Privacy

We use cookies to ensure that we give you the best experience on our website. If you continue to use this site we will assume that you are happy with it.Ok