• Skip to primary navigation
  • Skip to main content
  • Skip to primary sidebar
  • Skip to footer

TraderGav.com

Gav's trading blog - Perseverance, Consistency, Confidence

  • Home
  • Start Here
    • Back to Basics of Trading
    • Resource For Traders – The Best Tools for Traders
    • Learn Trading Articles
    • Sierra Chart Resource
  • Blog
    • Blog Posts
    • Other learning resource
    • Dummy Collection
    • Harmonic setups
  • About Me

headline post

Sierra Chart sharing: ChartDom Entry chart

by Gav

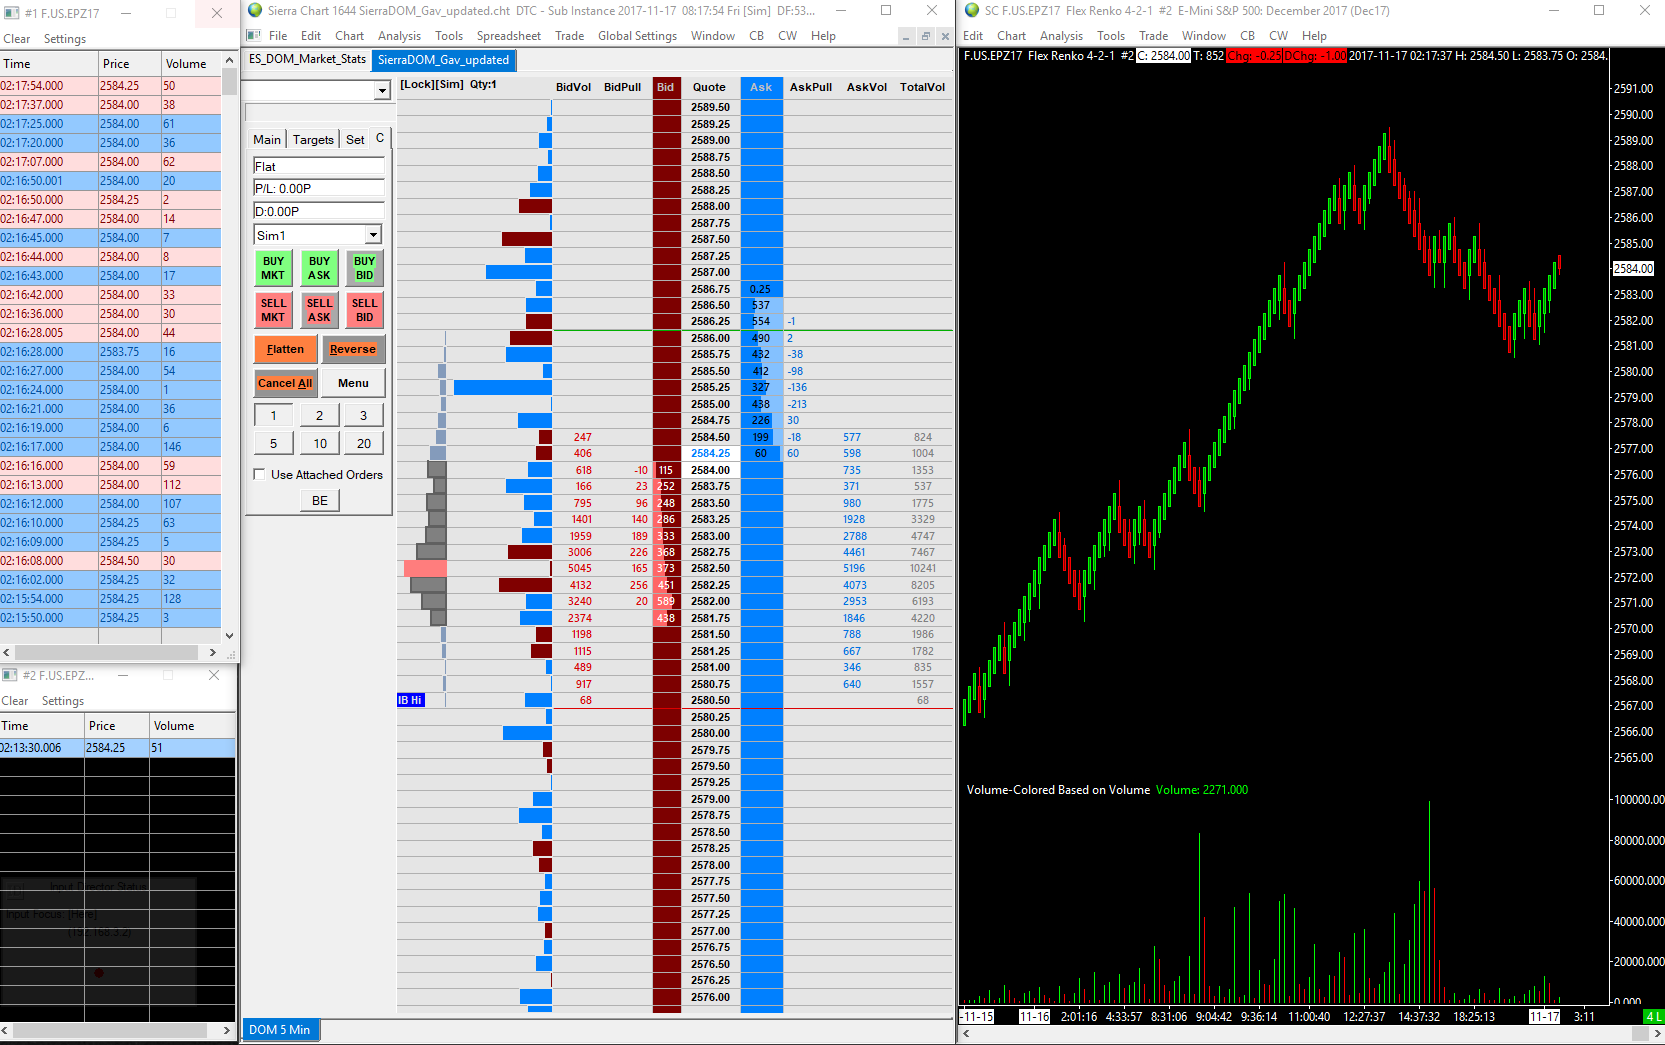
Chart DOM is one of my favourite Sierra Chart features. It gives users the flexibility to synchronize chart, and DOM. Chart DOM has all features of traditional Sierra Chart DOM, with ability to attach (and synchronized) into a chart. Sierra Chart DOM is higly customisable, and light weight.

In my trading, I always have a chart, which I call “Entry Chart”. It is a simple Footprint/Numbers Bars with Chart DOM attached. I have customized the Chart DOM with additional columns such as Bid/Ask Market Pulling stacking, Recent Bid/Ask volume etc.  The main purpose is to have a quick view of price movement (from Footprint/Numbers Bars chart), while trading on DOM.

I have attached the chartbook here. Please feel free to download, customize, and share it if you found it helpful.

You can download the chartbook HERE.

Enjoy!

Filed Under: headline post, Sierra Chart Resource, Trading Tools Tagged With: Sierra Chart, Trading Tools

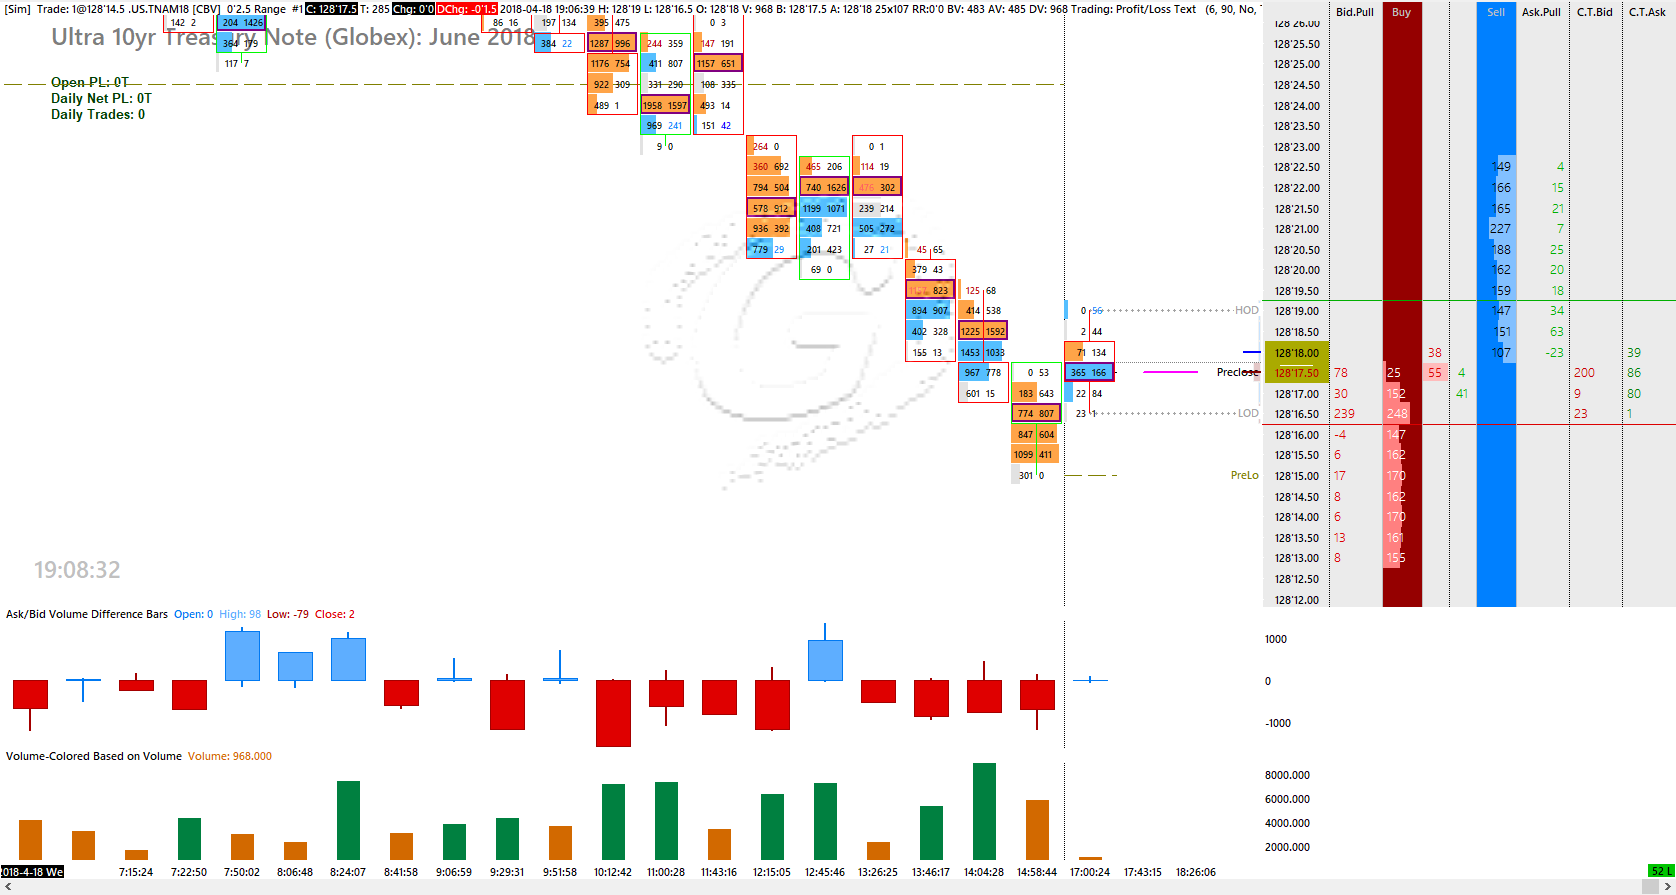
Sierra Chart Book sharing: Updated Trading DOM template November 2017

by Gav 5 Comments

I have made changes to the my Sierra Chart trading DOM over time, I thought I will share it here again. The previous version is working, this version is just enhanced with more information that I used in my trading.

Download the chart book and save it into Sierra Chart Data Files Folder, and Go to Sierra Chart and select File >> Open Chartbook . Feel free to customize it or share it to other Sierra Chart users if you like.

The DOM is used for ES (Emini-S&P), with CQG feed. Symbol can be changed in Chart Setting screen.

The Chartbook can be downloaded HERE 


Filed Under: headline post, Sierra Chart Resource

Sierra Chart Book sharing: Market Depth Historical Graph

by Gav 10 Comments

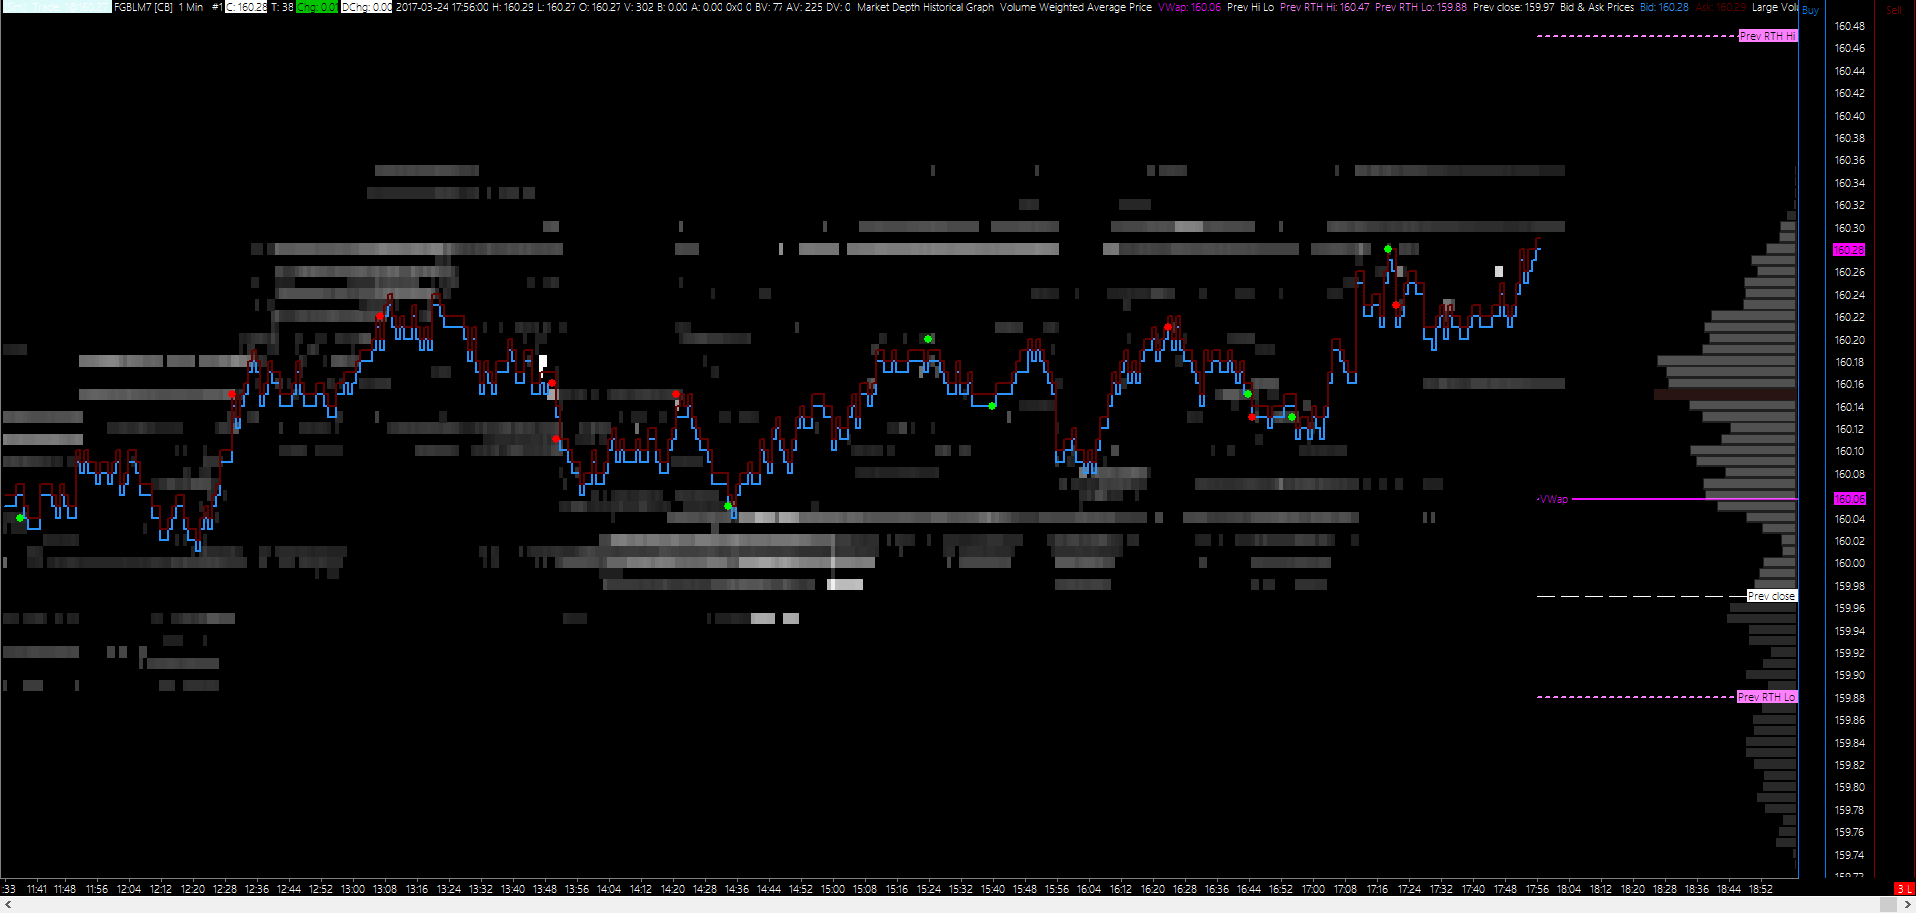
Sierra Chart introduced Market Depth Historical Graph at the end of 2016 after receiving requests from users. It is a tool which is similar to BookMap. The Market Depth Historical Graph study displays at each chart column the highest market depth quantity at each price level, which occurred during the timeframe of the chart bar, as a color-coded rectangle.

Here is the chartbook I use for my trading.  In order to use Market Depth Historical Graph,  “Record Market Depth Data” has to be activated as follow:

  • Select Global Settings >> Symbol Settings on the menu.
  • Locate the symbol or symbol pattern for the Symbol in the list of symbols, that you want to use the Market Depth Historical Graph study with.
  • Select the Intraday tab.
  • Enable the Record Market Depth Data option.
  • Press OK.
  • Reconnect to the data feed with File >> Disconnect and File >> Connect to Data Feed after altering the Symbol Settings.

Please feel free to download, customize and share.

Market Depth Historical Graph Chart Book


Tips (no obligation!)

Filed Under: headline post, Sierra Chart Resource

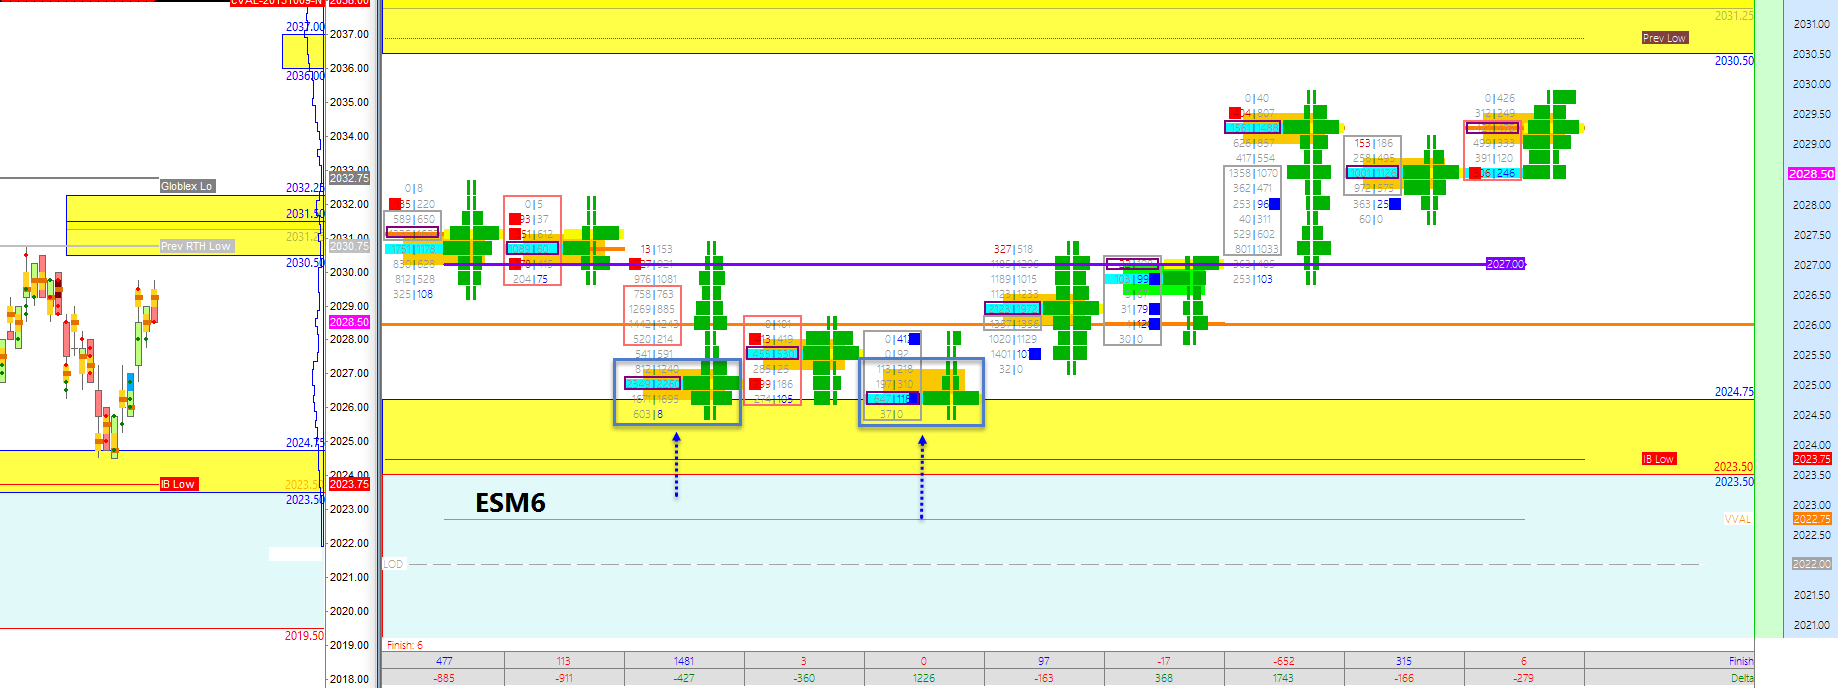
Sierra Chart Sharing: Number Bar (Footprint chart)

by Gav

numberbar

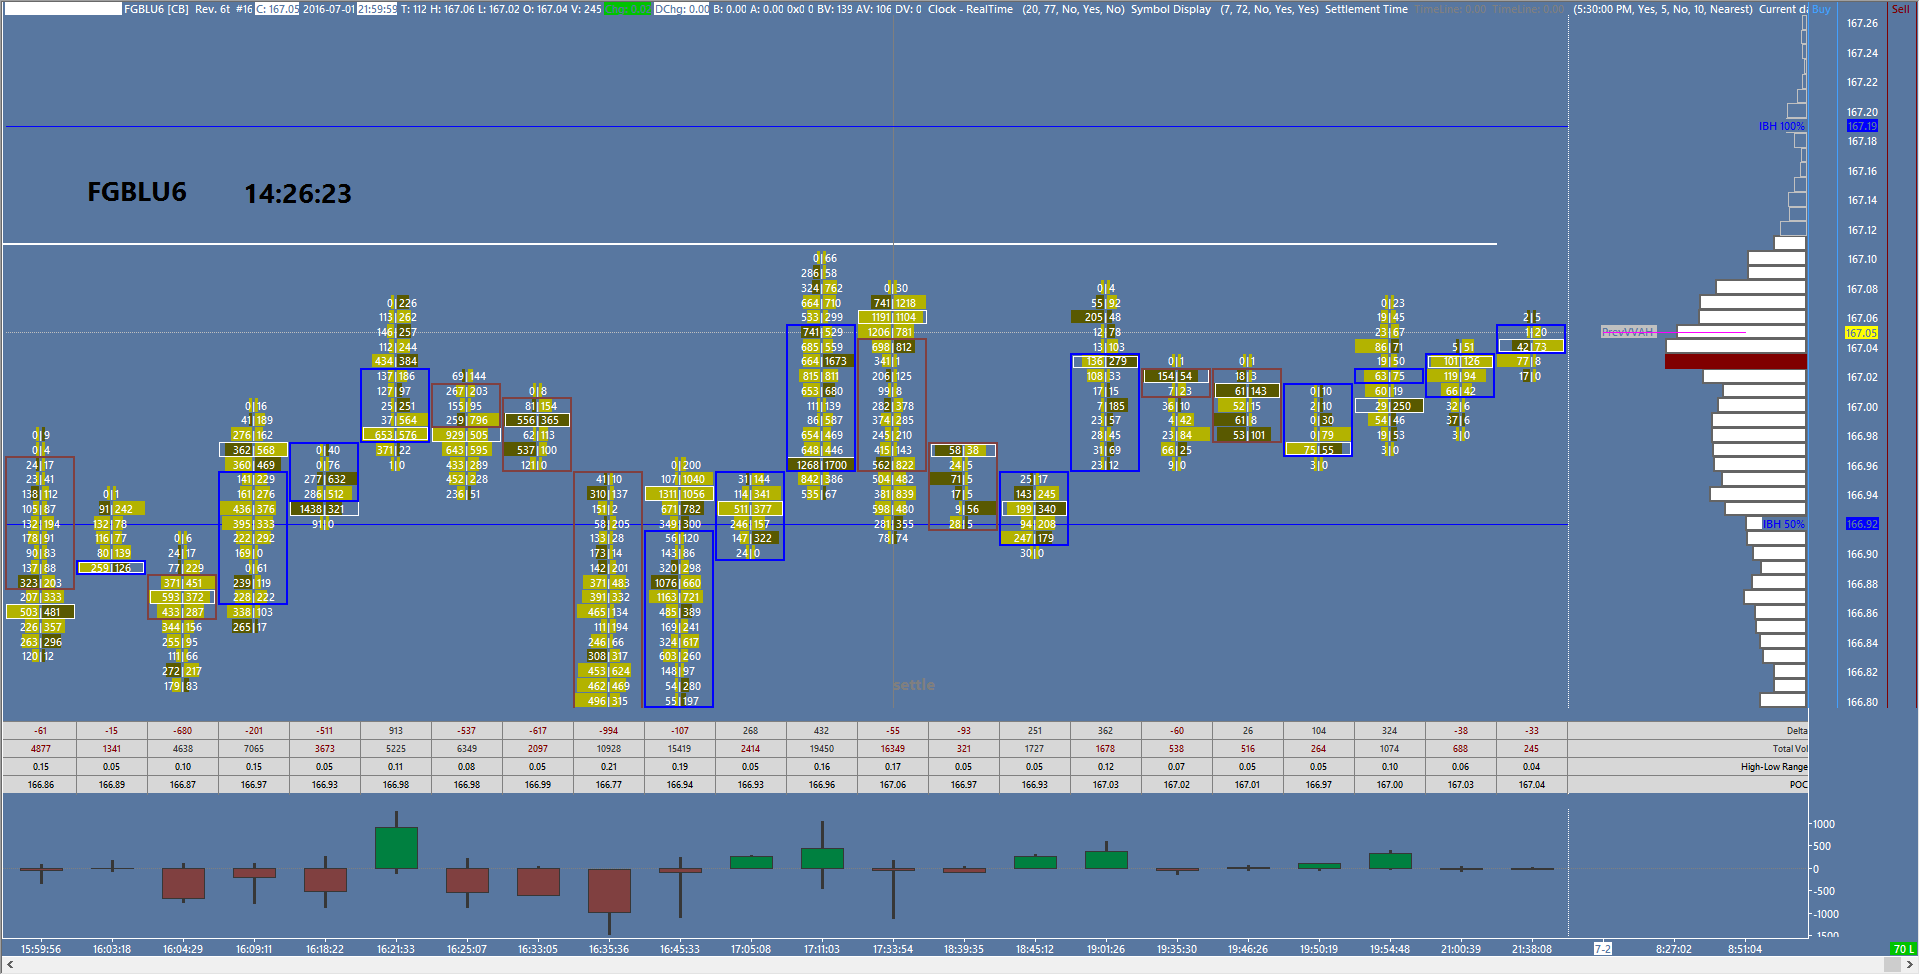
Number Bar/Footprint chart is one of the most important tool in my day trading toolbox.  Sierra Chart provides users built-in studies for it.  Sierra Chart is a very well-designed, and stable charting platform, and it is also very flexible for users to customise.

I am sharing a chart book with Number Bar setup and some of my own customisation. Feel free to download and copy to your trading chart. I hope this will save you some time in case you are new to Sierra Chart or Number Bars.

Download the chart book and save it into Sierra Chart Data Files Folder, and Go to Sierra Chart and select File >> Open Chartbook . Feel free to customise it or share it to other Sierra Chart user if you like.

Download here

Enjoy!

Tips (no obligation!)

Filed Under: headline post, Sierra Chart Resource

EOD contextual view of Bund, ES 19-20 May 2016

by Gav Leave a Comment

Key summary:

  • ES false break of previous swing low 2026
  • Bund found support at 163.09
ES false break at previous swing low
Inside view of ES false break
Bund found support at 163.09
Inside view of Bund reaction at support level

Filed Under: Footprint, headline post, Market Profile, Trading Journal

EOD contextual view of Bund, Stoxx, ES 18 May 2016

by Gav Leave a Comment

Key Summary:

  • Bund continued auctioning lower, finding lower balance
  • Stoxx trading within bracket
  • ES failed to break previous swing low, trapped sellers
BUND (FGBL) Failed to test prev day's upper balance zone, auctioned lower.
BUND (FGBL) Failed to test prev day’s upper balance zone, auctioned lower.
Stoxx (FESX) trading within bracket.
ES trapped sellers at 2033.75
ES: Inside view of sellers trapped

Filed Under: Footprint, headline post, Market Profile, Trading Journal

  • Page 1
  • Page 2
  • Page 3
  • Interim pages omitted …
  • Page 10
  • Go to Next Page »

Primary Sidebar

Best Tools For Traders

Recommend FX Charting

Footer

Recommended FX Charting

Recommended Training

FXSAnalytics
Price Action Course for Professionals

Copyright © 2025 · Affiliate Disclosure · Privacy

We use cookies to ensure that we give you the best experience on our website. If you continue to use this site we will assume that you are happy with it.Ok