Here is the economic calendar for the coming week.
[photopress:ecocalendar.PNG,full,centered]
Here is the economic calendar for the coming week.
[photopress:ecocalendar.PNG,full,centered]
I was taking extra risk when trading with a exhausted body (Highly unadvisable). Short position of E-mini Nasdaq was established below 1030am chicago time candle. It was NR5 as well. I was being cautious with the trade when Nasdaq index had already lost around -25 points. I decided to close the trade when the next big candle at 11am chicago time came with lousy volume. It did not seem to be a sell off, chance of mid day reversal was there. First trade after a great vacation with 0.44-R gain (or maybe 0.44 ‘Z’ gain 🙂 )
[photopress:E_mini_Nasdaq_30_min_trade_closed.jpg,full,centered]
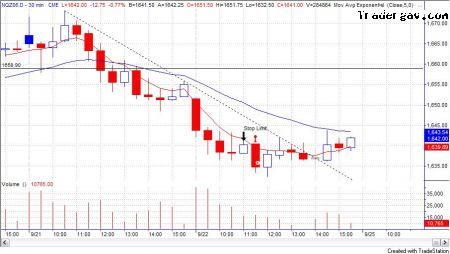
1) Why would you be paying attention to this futures contract ? Intraday downtrend established with dummy setup in conjunction with NR5 was found.
2) Is the trend up or down? Would you be looking to get long or short this futures contract? Down, looking at Short only
3) Where would you get long/short this futures contract ? Below 1030am chicago time candle (NR5 candle)
4) Where would you put the initial protective stop? Above 1030am chicago time candle (max 1.06% risk)
5) When would you stop trading for the day? After position established or after 12 noon
6) Where would you exit the position ? When market sentiment failed to continue (i.e market failed to sell off further) / stop loss triggered.
Success truly is the result of good judment. Good judgment is the result of experience, and experience is often the result of bad judgment!
So, vacation is over. I am back in action with a little overweight. It should be a light day for me, since I am just back from Taiwan. More on my trip later, in short, it was wonderful.
We have a small gap down in 5-min chart of E-mini S&P. Volume crosses 10K bar test for the first 30 minutes. E-mini Nasdaq, mini-sized Dow, E-mini S&P and E-mini Russell are moving in negative zone today. I will be focusing on any Short opportunity at this point of time.
My quest of great food begins! I will be visiting as much as night markets as possible to taste all the great taiwanese food!
Well, in case you are interested, do come back to my blog. I will be sharing with you all…….photo of the food…:lol:
[photopress:Taiwan0083.jpg,full,centered]
[photopress:Taiwan0066.jpg,full,centered]
Ah..option expiration day. Most likely , you might get chopped out. I did not trade, anyway, there was no setup as well. So I did not make any ‘Z’ . 🙂 Here are some 30-min charts to show how boring was the session.
E-mini Nasdaq
[photopress:Emini_Nasdaq.jpg,full,centered]
E-mini S&P
[photopress:ES.jpg,full,centered]
mini-sized Dow
[photopress:mini_dow.jpg,full,centered]
E-mini Russell 2000
[photopress:Russell.jpg,full,centered]
There was a gap up in 5-min chart of ES (E-mini S&P). Volume is healthy as shown in first 30-min. E-mini Nasdaq and E-mini Russell 2000 had gap up in 30-min chart. So far, intrady, market tone is positive. If I were to trade today, I would only consider Long position.

