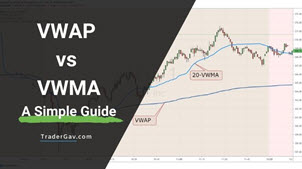
VWAP is one of the most popular day trading tools. Is VWMA the same as VWAP? Read this VWAP vs VWMA post to find out
Blog and Rants
How To Draw Support Resistance Levels- A Simple Guide
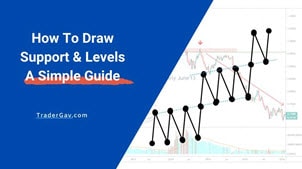
Support and Resistance levels are the oldest and the most effective way to analyse the market. In this post, I will show you how to draw support and resistance levels
Next trade is more important
Forget about your past trades. Keep the focus on the price action, and the next trade is always more important.
Sierra Chart sharing: ChartDom Entry chart
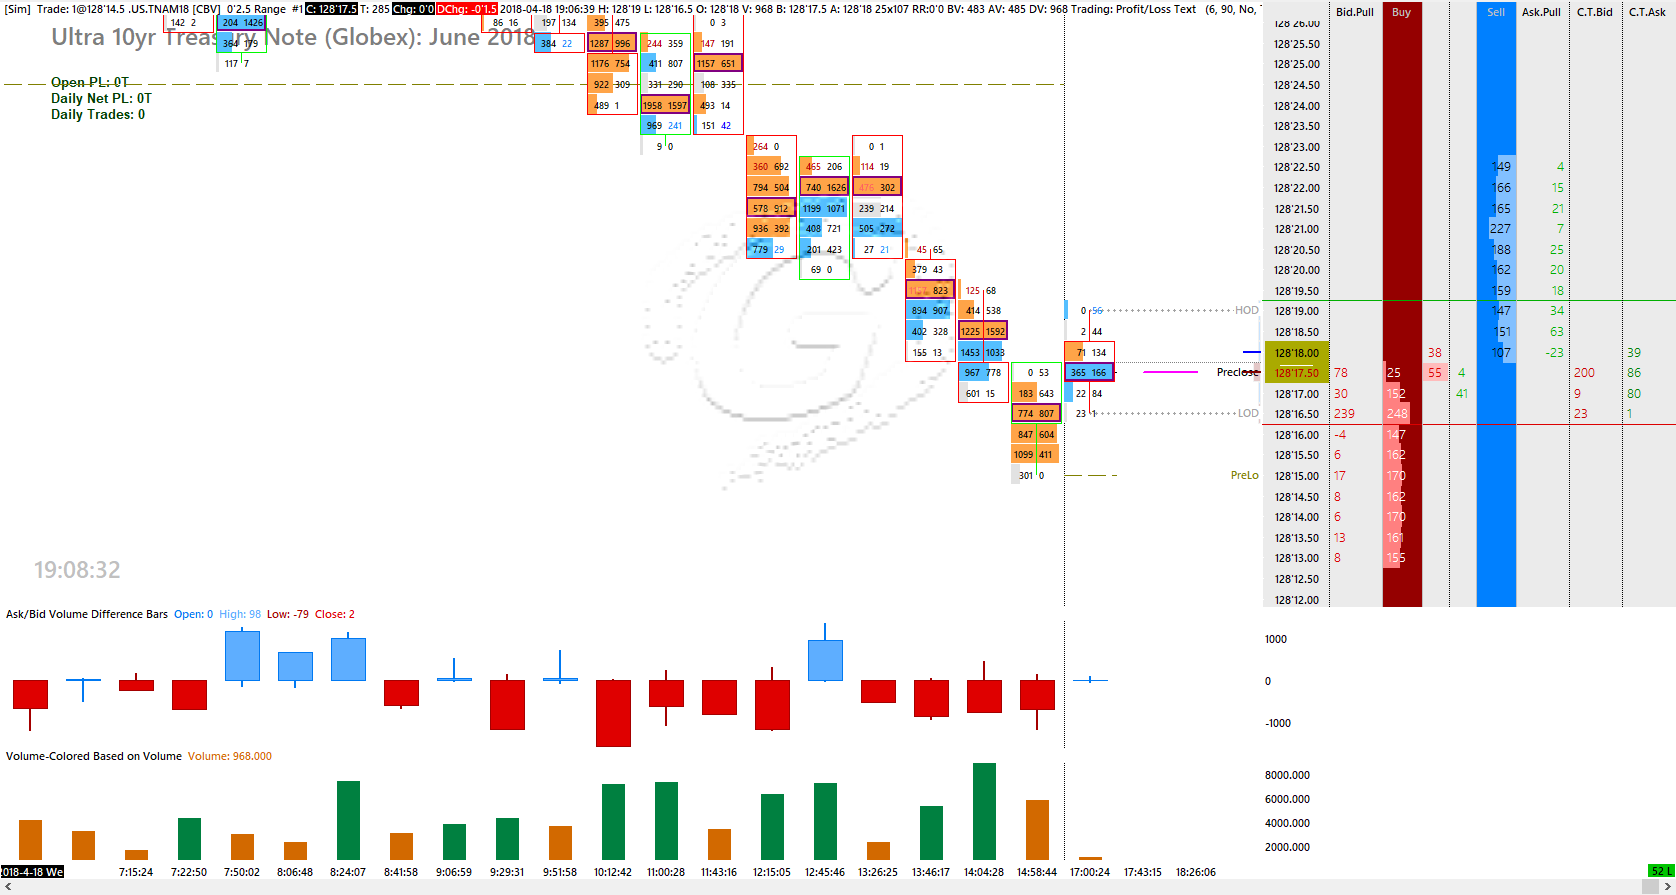
Chart DOM is one of my favourite Sierra Chart features. It gives users the flexibility to synchronize chart, and DOM. Chart DOM has all features of traditional Sierra Chart DOM, with ability to attach (and synchronized) into a chart. Sierra Chart DOM is higly customisable, and light weight. In my trading, I always have a […]
Market Prep 02 April 2018 zone of interest
I am working on new way to present my daily preparation on the blog in order to include as much helpful information as possible without putting on extra burden to myself. It is still work in progress (presentation wise). For the time being I will continue posting my daily zones for my own end of […]
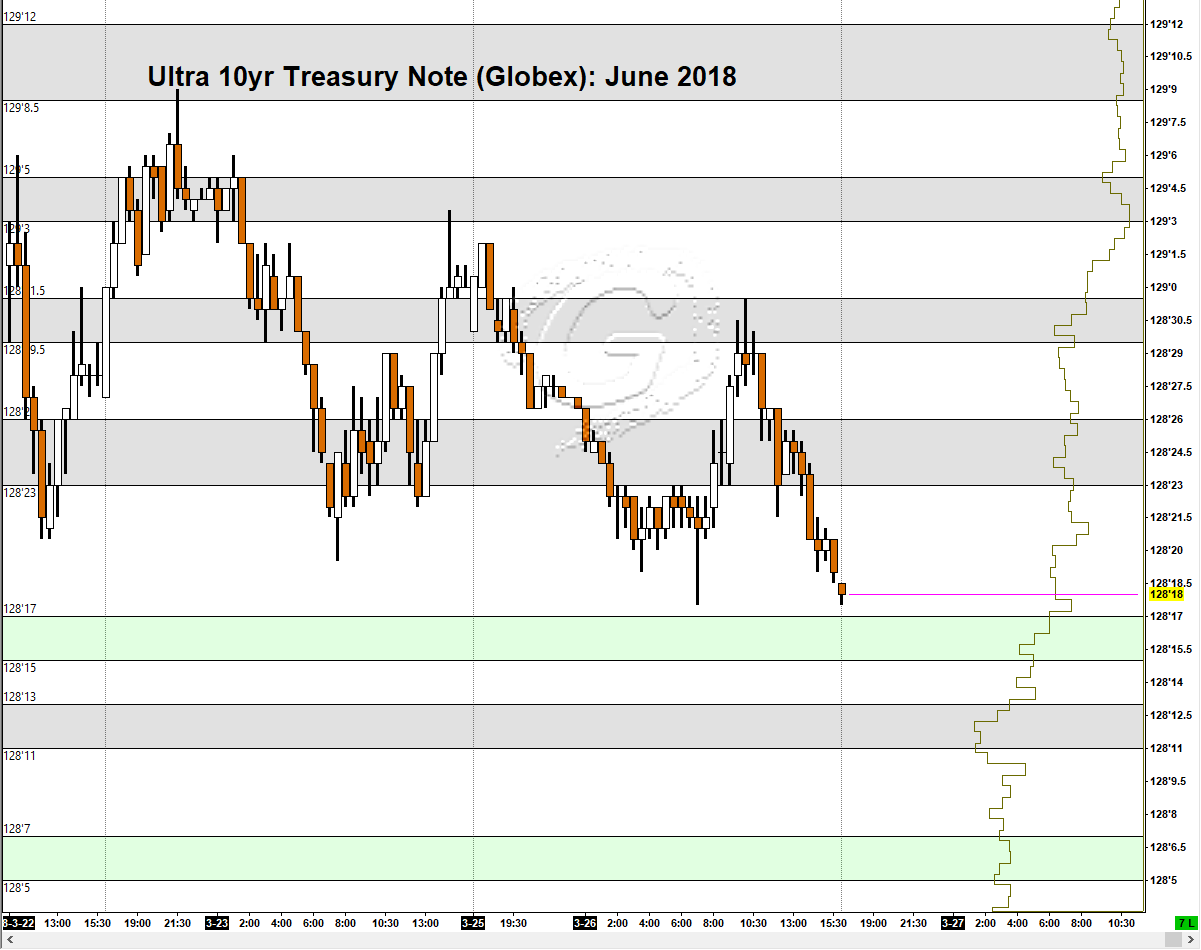
Market Prep 27 Mar 2018 zone of interest
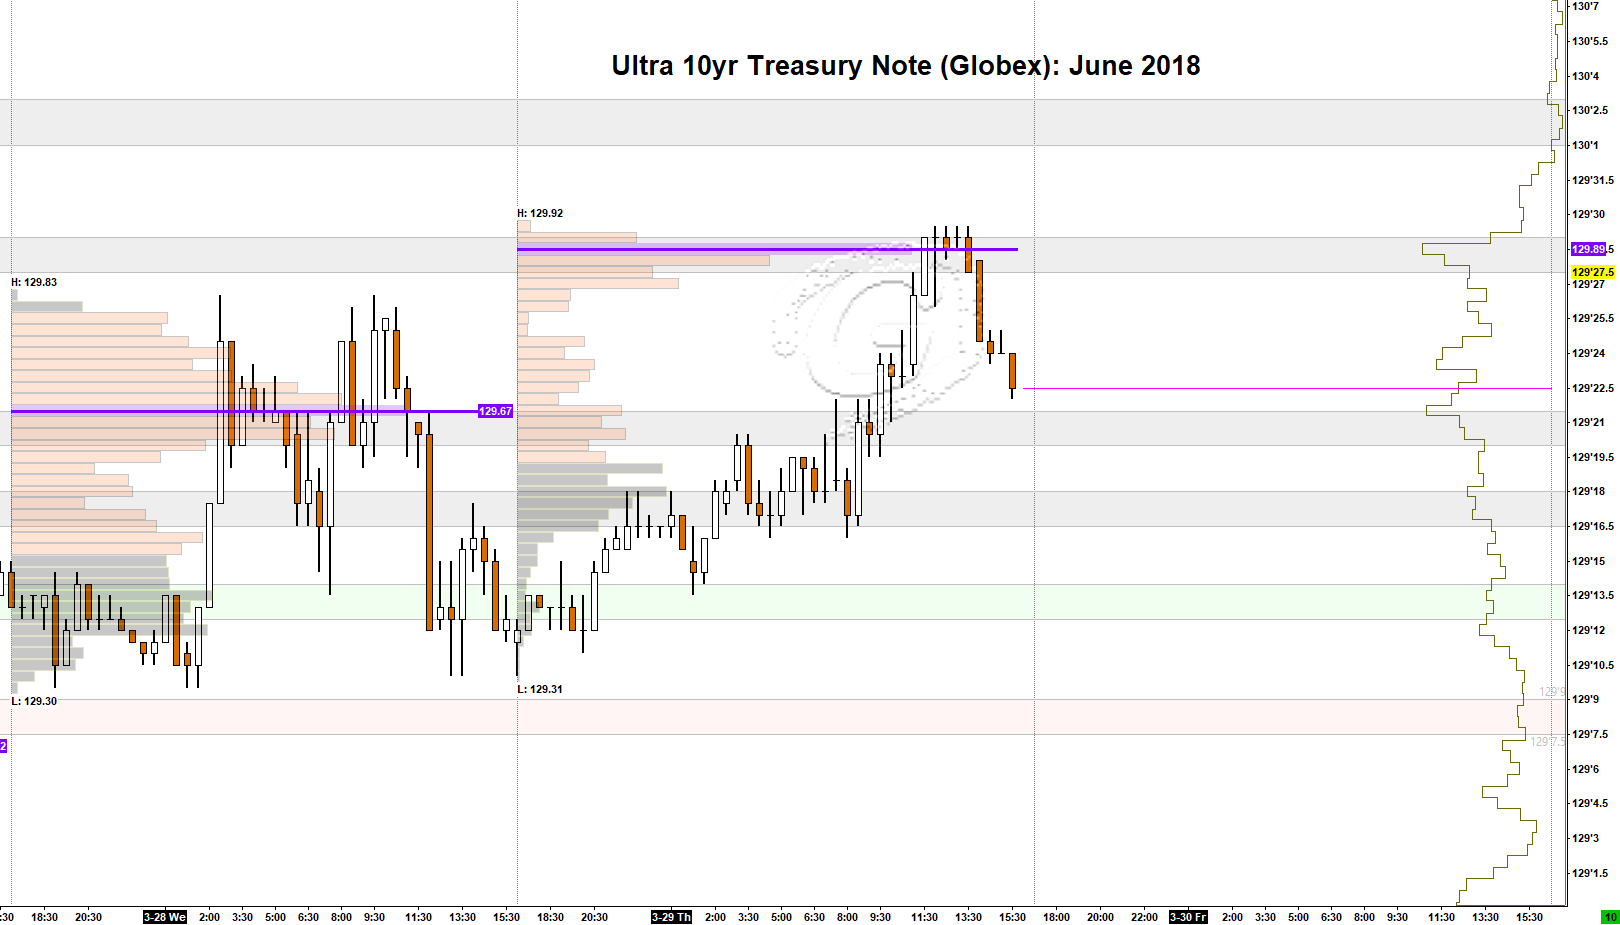
Here is the charts for 27 March 2018 with zones of interest marked. Markets covered: Ultra 10yr US Treasury Note – TN June 18 Contract Basic Principle = Trade Location → Order Flow→Execution
