VWAP is one of the popular indicators used by traders. It is an intraday indicator, which best serves short term, particularly day traders.
Because of the volume component and the similarity of its name, traders often confused VWAP and another volume-associate indicator VWMA.
This is your simple guide of VWAP vs VWMA.
Are VWAP and VWMA the same? The answer is NO. Fundamentally, they are different. They serve different purposes.
If you are looking for an explanation of VWAP and VWMA, you are in the right place.
In this post, I will show you the difference between VWAP and VWMA.
We will look at the construction of these two indicators. The best way to determine if an indicator is useful to your trading is to understand the math behind it.
Without further ado, let’s look into the details now.
Try Tradingview Pro Charting Platform For 30 days
Tradingview is my go-to FX charting and trading solution. I have done extensive coding and trading on the platform. I am happy to recommend them.
If you are interested in using Tradingview, you can try out the Pro membership FREE for 30 days. This is an excellent time to check out the powerful features of Tradingview charting.
VWAP vs VWMA – The fundamentals
What is VWAP?
VWAP stands for Volume Weight Average Price. It is a day trading indicator. The indicator’s calculation resets at the beginning of each trading session.
VWAP is widely used by both institutions traders and retail traders. Institutional traders use it to guide their positioning decisions while retail traders mostly use it to decide if the market is under or overvalued.
To understand how to effectively use VWAP, let’s look at the construction of the indicator.
How to calculate VWAP
VWAP is the cumulative average price with respect to the volume.
Take note that VWAP uses the typical price. Typical Price can be calculated by averaging High, Low, and Close prices.
Typical Price = (H+L+C)/3
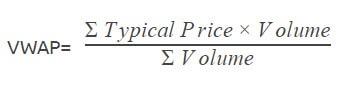
Let’s look at the formula of VWAP.
VWAP = Cumulative(Typical Price x Volume)/Cumulative (Volume)
Or
A quick explanation of VWAP calculation:
- Calculate the typical price of a specific time period by (High + Low + Close)/3
- Multiply the volume of the period to the typical price. (Volume x Typical Price)
- Calculate the cumulative total of (Volume x Typical Price) since the session’s open.
- Calculate the cumulative total of volume since the session’s open.
- Find the ratio of Cumulative Total of (Volume x Typical Price) and Cumulative Total of Volume. This is the VWAP.
VWAP applications
Institutional traders use VWAP as a benchmark for their trade executions. Institutional automated trading strategies often execute their orders around VWAP to avoid a huge spike in volume.
For day traders, VWAP serves as a reference point. It is similar to the Volume Point of Control of Volume Profile. Traders use it as a reference to decide if the current market price is over or undervalue.
What is VWMA
VWMA stands for Volume Weight Moving Average. The name often confused traders.
VWMA is one type of moving averages. In addition to closing prices, VWMA incorporates volume into the calculation.
If you are familiar with the moving average, it is easy to get a hang of the concept of VWMA.
How to calculate VWMA
To understand the calculation of VWMA, let’s start with Simple Moving Average.
A Simple Moving Average is the average of closing prices over the past N periods.
For example, 3-Day Simple Moving Average
3-Day SMA = (Close1+Close2+Close3+Close4+Close5)/5
Now, let’s look at the VWMA. Volume Weight Moving Average is calculated as below:
C=Close
V=Volume
3-Day VWMA= (C1xV1+C2xV2+C3xV3)/(V1+V2+V3)
As you can see from the formula, each closing price is weighted with its volume. In other words, the closing price with higher volume carries more weight in the calculation.
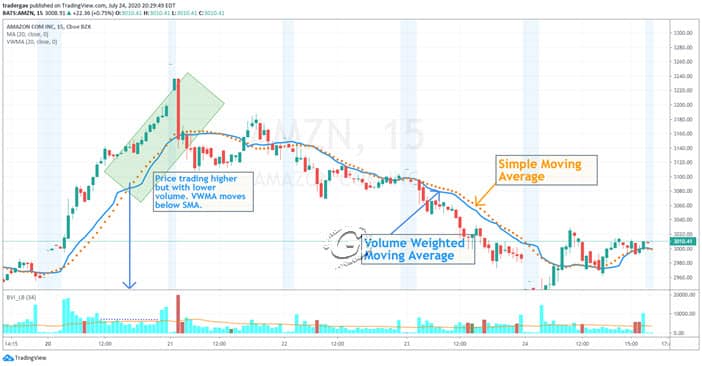
The chart above illustrates the difference between VWMA and SMA.
SMA rises when the market rises, as it is an average of closing prices over the past 20 periods.
For the same look-back period, the VWMA moves below SMA when the market is trading higher but with lower volume.
VWMA applications
If you have already used a moving average in your trading, VWMA might give you additional insight.
There are traders using VWMA & SMA crossover to determine trend strength. This approach adds a new dimension to trend analysis with volume weighting.
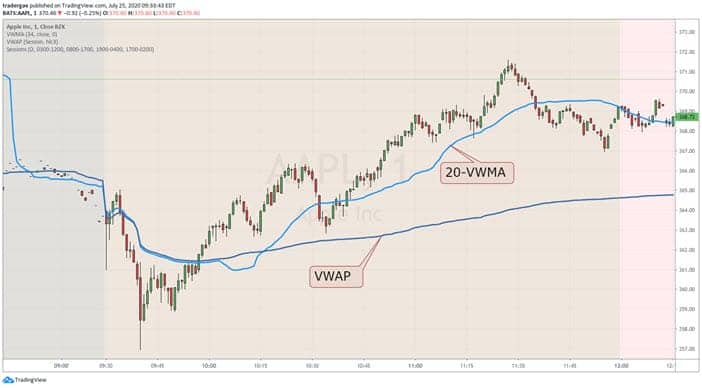
Trading with VWAP
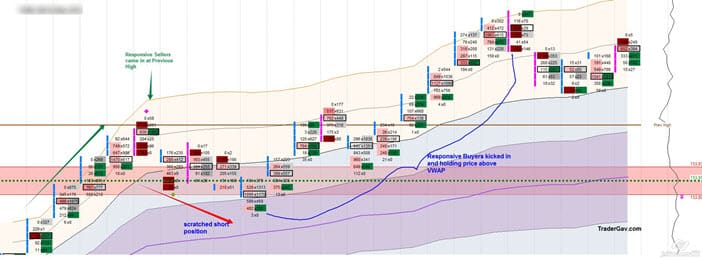
As a day trader, VWAP is one of the essential tools in my trading. I mainly used it in futures trading.
There are many ways to trade with VWAP. One of them is to work along with Volume Profile and order flow analysis.
With the understanding of the Auction Market Theory, you can build an effective day trading strategy.
Recently, I have been trying it in the Forex market. Although tick volume is less than desirable, it does offer a good general read of the market.
Conclusion – VWAP vs VWMA
I hope you have a good understanding of the constructions of VWAP and VWMA now.
The key differences between VWAP and VWMA are:
VWAP is cumulative of average price with respect to volume. It does not drop off any data over time. The calculation begins at the start of the trading session.
VWMA is a type of moving averages. The indicator calculates the average of closing prices with respect to the volume. It has a fixed period where older data will be dropped off from the calculation. The calculation is continuous across sessions.
They are different indicators and should not be confused.
You do not need more indicators to achieve success. As a rule of thumb, if it confuses you, chuck it in the bin.
Trading Tools
The charts posted on this post are created using TradingView. It is my recommended charting platform for Forex trading purposes. It offers a wide range of market data, the flexibility of strategies and indicators building using PineScripting, and live trading integration.
If you are interested in knowing more about the tools I use in my trading, such as trading journal, charting platform, or trading course check out my Resource page.
Do you have any experience trading with VWAP or VWMA?
Do you have any questions? Feel free to drop me a line in the comment section. I am happy to help.


I use Fidelity ATP for trading. My account positions show VWAP. My charting only has VMA or VAMA. Which indicator is better for day trading? I would like to use VWAP but it’s not available. I called Fidelity and no help. Can you help?
Hi Sonny,
I am not familiar with Fidelity. Never traded with them, so I’m afraid I can’t offer any help on that matter.
So on a 1 hour crypto chart, a 24 length VWMA based on hlc3 would, after 23 hours and 59 minutes, be the same as a VWAP line about to reset.. hmm interesting
For a 24/7 market like crypto it seems the resetting of the VWAP is a great disadvantage. It suddenly becomes akin to a VWMA based on barely any data, like a 2 period VWMA, until later in the day when it finally has almost a day of data in it, only to reset back to nothing, meanwhile the VWMA maintains a full day of average volume price within it at all times. A “hlc3 VWMA” is like a full VWAP without the reset. Is my reasoning correct?
Can confirm. My 1440 hlc3 VWMA on the 1 minute chart matched perfectly with my 1Day VWAP in the final moments before the VWAP reset.
You mentioned using VWAP with Volume Profile for futures trading. Would you mind elaborating in what way do you combine the two ?
This question can’t be answered in a few sentences. It requires lot of screen time to get a good feel of it. I would suggest you have day profile and VWAP on your day session chart. observe the trading opportunities at different trade locations.
Hope these help.
I second this OP I would like to know more about using volume profile with VWAP observing different trade location only helps so much can you just elaborate as OP said? What kind of volume profile should I be looking for in relation to VWAP etc..
Personally, I use session volume profile. Observe how market reacts at HVN/LVN etc. If trading futures, also consider how the order flow plays out. Hope these help.