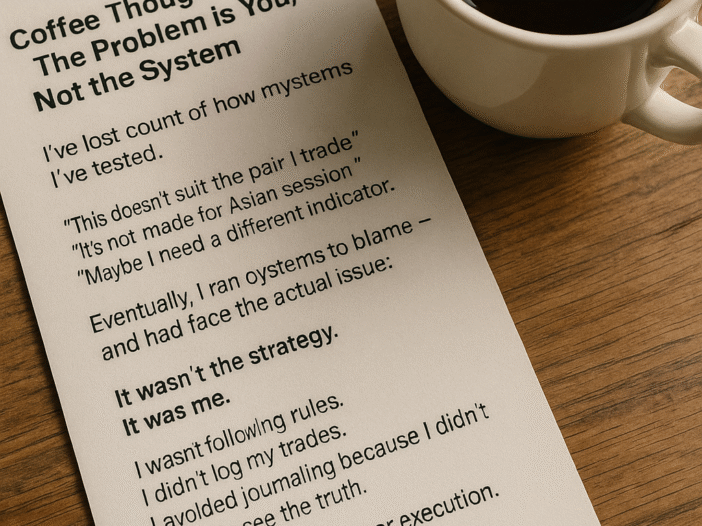
I’ve lost count of how many systems I’ve tested. Breakouts, pullbacks, trend following, mean reversion. You name it. Every time something didn’t work, I blamed the system.“This doesn’t suit the pair I trade.”“It’s not made for Asian session.”“Maybe I need a different indicator.” Sound familiar? Eventually, I ran out of systems to blame — and […]
Cleaning My Charts Like Cleaning My Kitchen
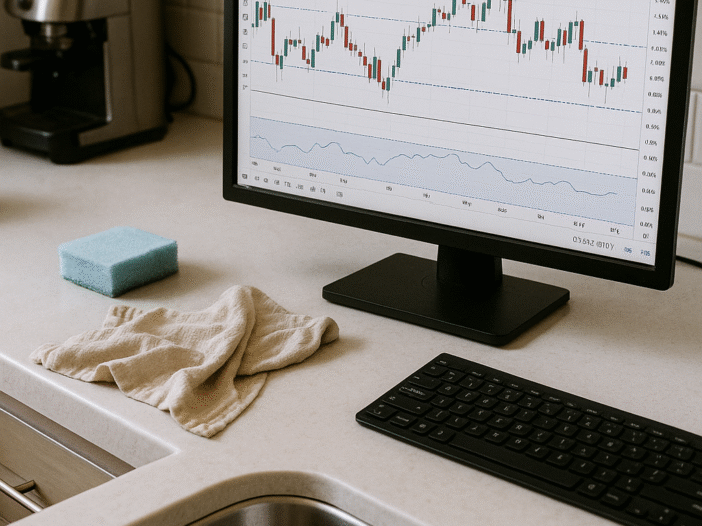
It’s Sunday afternoon. I’m not trading, but I’m doing something just as important. I’m cleaning the kitchen. The counter’s a mess. Crumbs under the toaster. A drip trail of coffee from this morning. A few dishes that “look clean enough” until you hold them up to the light. So I wipe. I rinse. I reset […]
Coffee Thoughts – Trading Alone Doesn’t Mean Trading in Isolation
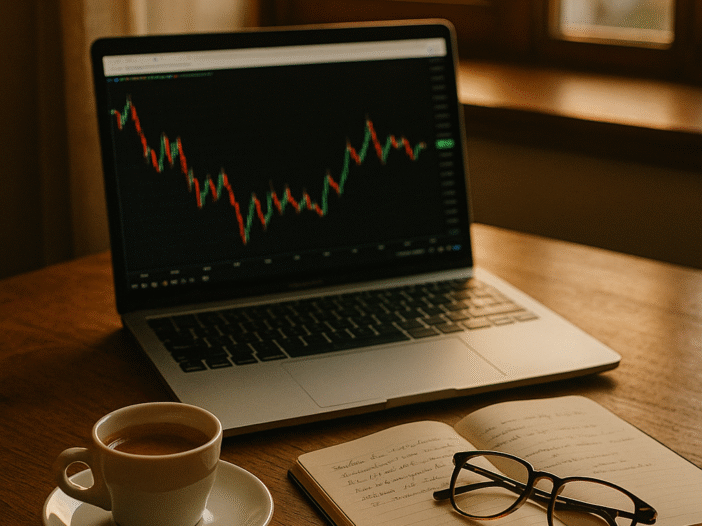
I trade alone. I’ve always preferred it that way. Just me, the chart, and my rules. But here’s the thing I had to learn the hard way — trading alone doesn’t mean isolating yourself from the world. In the early years, I went full monk mode. No forums. No chats. Just grind and suffer in […]
The Quiet Trader: The Morning Run and the First Trade
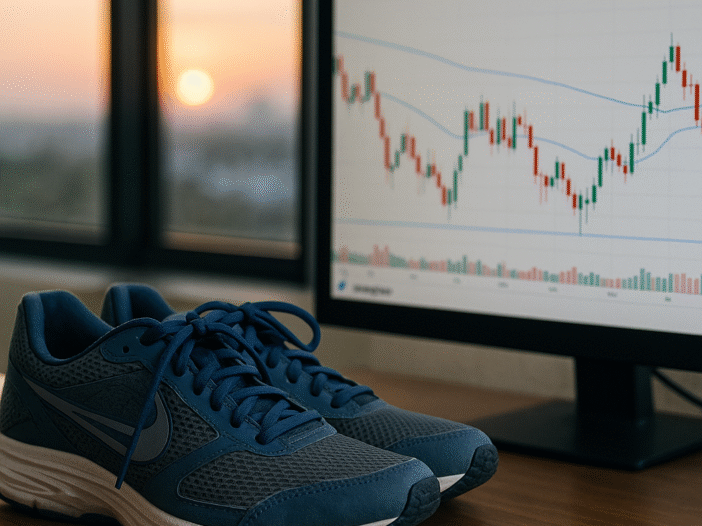
A sluggish start on Monday. A rushed prep on Tuesday. And a not-so-great trade to kick off Wednesday. That pretty much sums up the first half of my trading week. But this post isn’t about the trades. It’s about something else that’s become part of the rhythm. I started running again. Nothing fancy. Just a […]
What I Thought Was Discipline Was Actually Fear
I’ve been trading pretty tightly lately. Rules set. Checklist followed. Pre-market done.No chasing. No overtrading. Just clean execution. Or so I thought. That kind of structure usually helps me stay sharp. But last week, something felt off. I’d mark up a level, see price line up perfectly… and still hesitate.No entry. No trade. Just a […]
Trading is About Location. Always Has Been

I’ve been deep in the trenches lately. Refining setups, rewriting plans, backtesting like a maniac (manually with Tradingview’s market replay— no fancy automation), setting up accounts, even negotiating commissions. It’s been intense. A bit draining, to be honest. But stepping back gave me space to revisit old trading journals, flip through a few good books, […]

