I wish I can start posting regularly again soon. Some personal businesses needs my attention lately. Anyway, I thought I would write a quick post about this educational event which might benefit some of you. Elliott Wave International (EWI) is hosting a free Trader Education Week, October 2-9. Register now and get instant access to […]
Updates, down time, futures trading etc
I thought I should write a short post just keep my 13 readers updated. I have been out of action for the past few weeks due to illness. Well, nothing really serious, but it was bad enough to keep me constantly tired and prevent me from trading and blogging etc. I have finally off the […]
Weekly Review of spot GOLD (XAUUSD) 16 AUG 2013
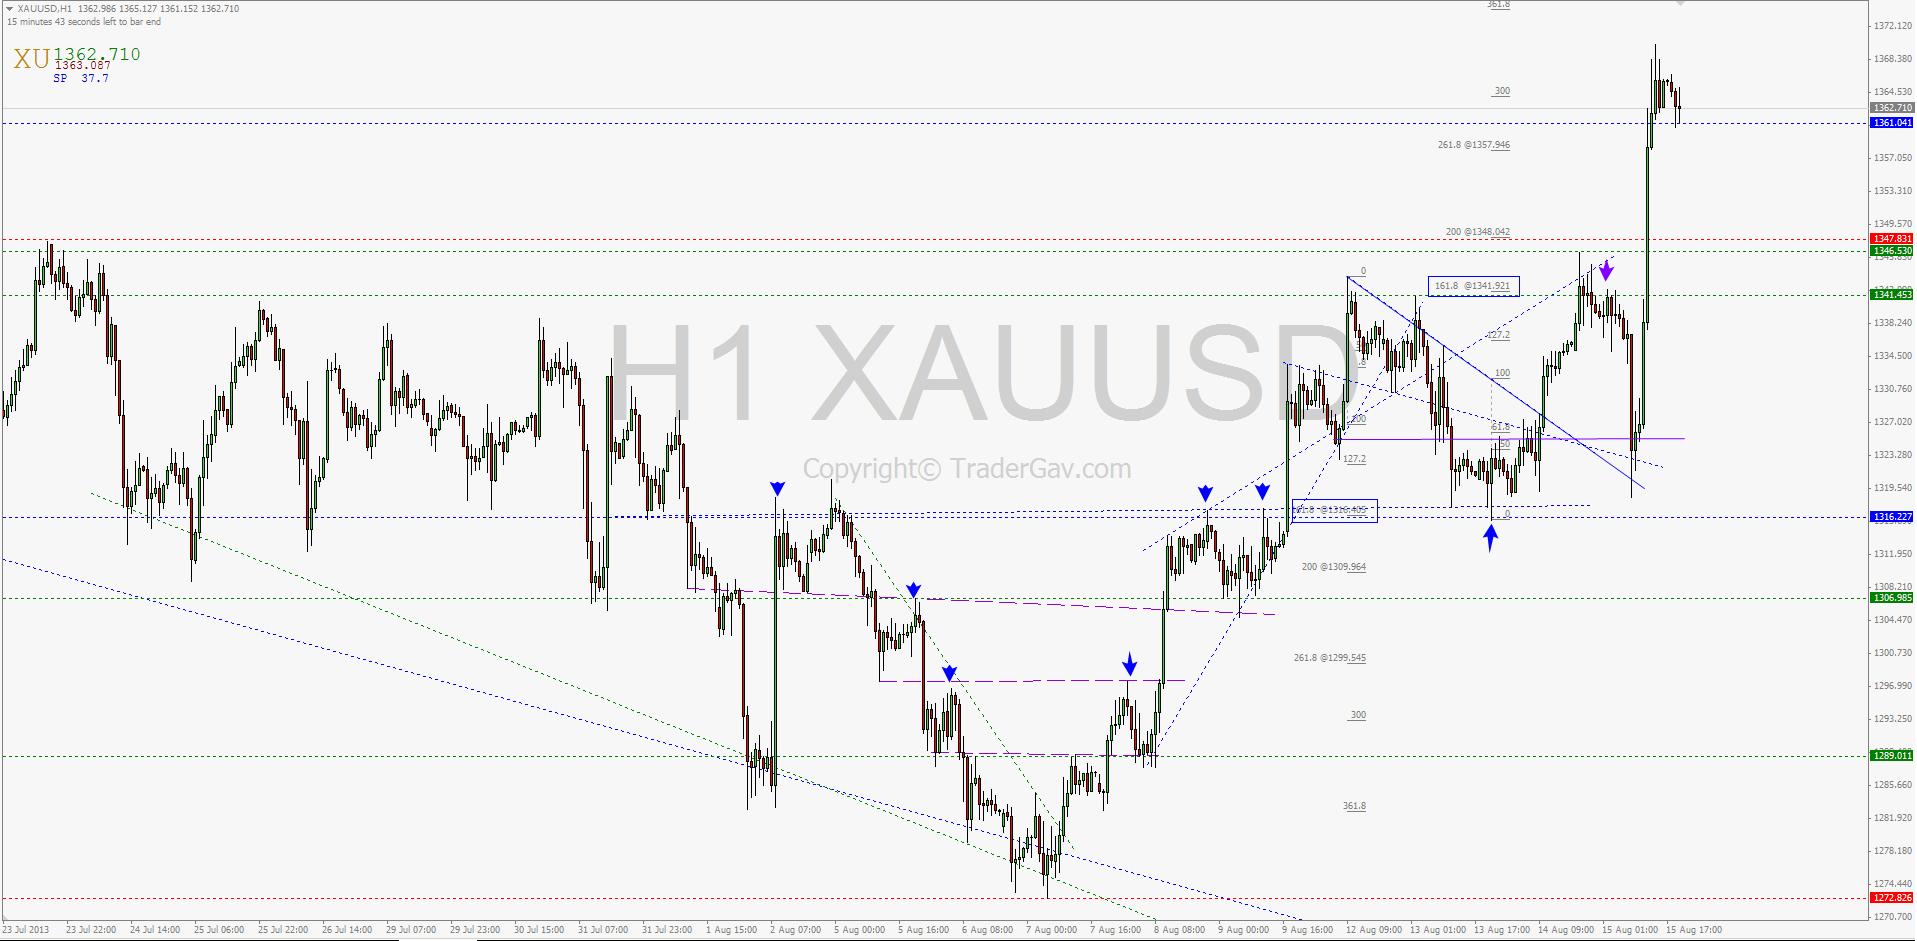
Here is the quick chart review of spot GOLD XAUUSD. You can also find last week’s chart review here. The best way to understand the movement is to look at the charts in multiple time frame. The charts basically explain everything. I will just try to give brief descriptions. On Thursday, Gold broke away from […]
Moving RSS Feed
This is a message for readers who subscribed for RSS feed/blog email update of this website prior July 2013. So if you are new free update subscriber, you are safe. 🙂 Previously, the RSS feed of TraderGav.com was handled by FeedBurner. I am now moving email update facility to Aweber. So, email subscribers will […]
One USDJPY trade 12 August 2013
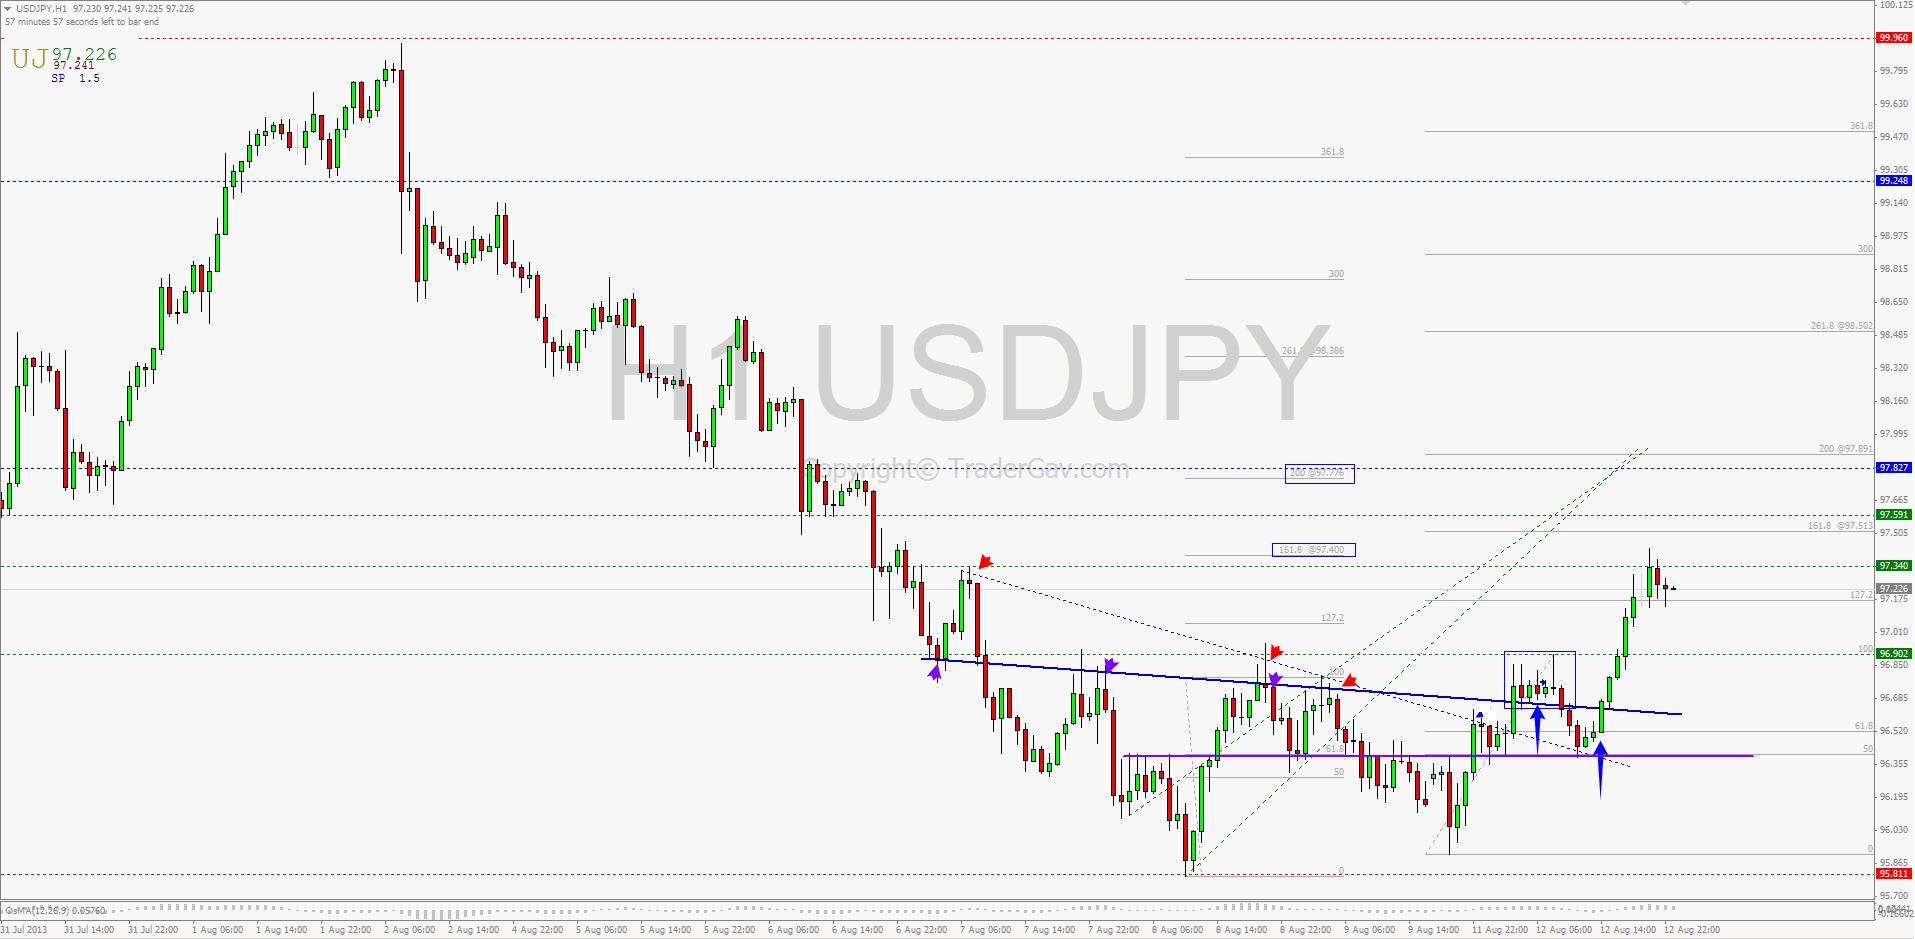
Just a quick post of one of the trades I made yesterday. I thought it might provide some educational value to my now 13 readers. I went long of USDJPY around mid London session yesterday. My entry was not the best I would like to have. I saw a small consolidation cluster around 96.75 , […]
Levels trading tips from hindsight analysis
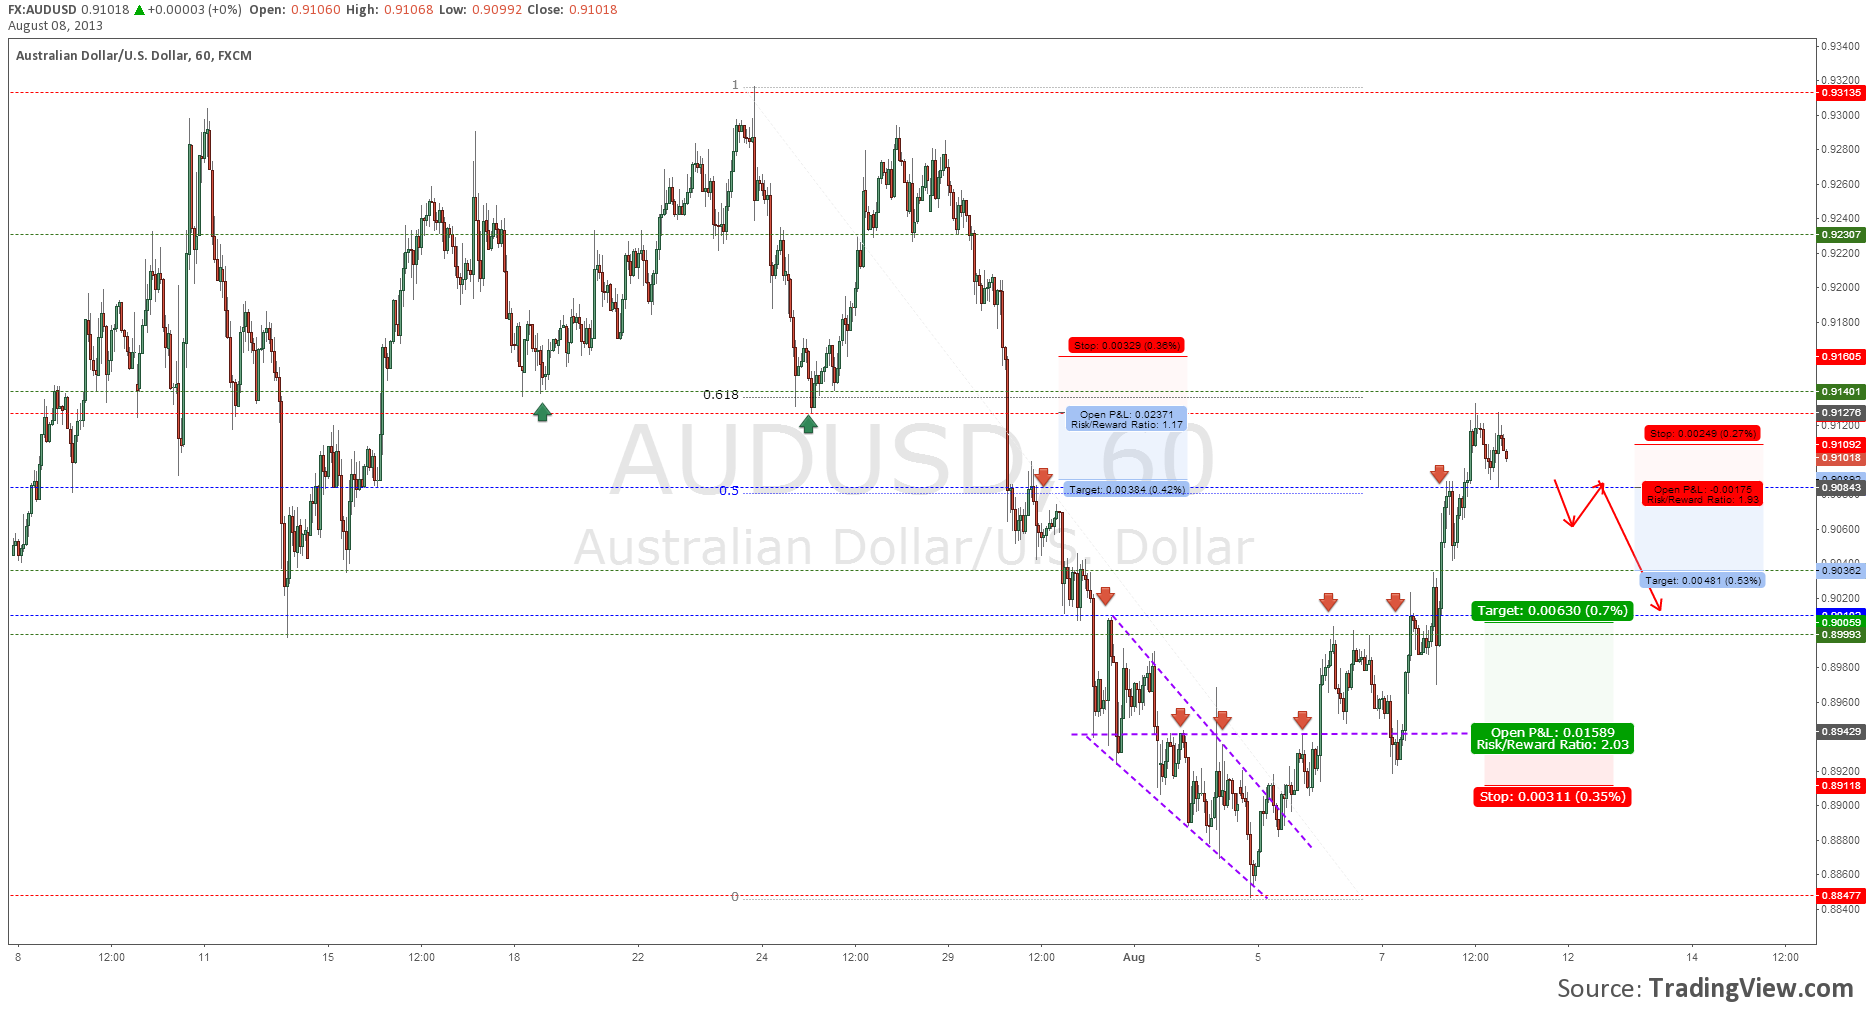
First of all, AUDUSD approached 0.9130/40 resistance level. This is a daily level, and price reacted and immediately pulled back to intraday (hourly) support level 0.9085. If you managed to get in short position at the first test of 9130 level, the setup should give you around 1 R at 0.9085. (Unless you used a […]

