Here I see some interesting stocks which appear to rebound. Though market sentiment remains negative, these stocks provide some quick short term trading opportunities. I saw tiong woon, C&O pharm, SKY china petrol, and InterraRes. I was preparing Monday’s stockst trading, when I was almost finishing, a sudden thought came into my mind. All the […]
RE: SIMSCI 23-June-2006
[photopress:Simsci_morning_10.jpg,full,pp_image] [photopress:Nikkei_morning_10.jpg,full,pp_image] I have decided not to trade today due to some personal commitment in the afternoon session. No short position for SIMSCI was established in ther morning after watching Nikkei making a higher low and failed to form a failure swing in RSI. It is likely to move up and might lead SIMSCI to […]
SIMSCI 23-June-2006: Potential short
In the first hour of trading, downtrend is formed. With Nikkei loses around -200 points and HangSeng loses around -150 point, sentiment is negative biased. I am looking for opportunity to establish Short position on SIMSCI.
RE:Paper Trade Series: Mini Dow 22-June-2006: Trade closed
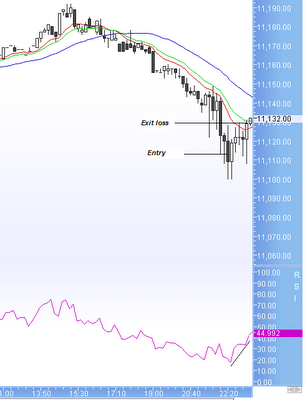
After watching RSI making higher low and 10-min chart showed a undecisive movement, I closed the trade at 11,130 , with -18 points loss.
Paper Trade Series: Mini Dow 22-June-2006
I am looking at Short position of Mini Dow at 11,112. A established downtrend is shown in 10-min chart.
RE: SIMSCI 22-June-2006: Long Trade Closed
[photopress:simsci_10_trade_close.jpg,full,pp_image] Long position of SIMSCI was closed at 282.4. Volume did not support buyers to push up further, and RSI was forming failure swing. A descending triangle was forming as well. I do not like the situation like this. Closed the trade with small gain. +0.4 point. I was very unhappy with the liquidity of […]

