This website is free and supported by readers. This post may contain affiliate links. Read the disclosure for more info.
Volume Weighted Average Price VWAP is one of the most popular and important day trading indicators.
VWAP is widely used by institutional traders to guide their positioning decisions. In recent years, more and more retail traders are utilizing the indicator to make trading decisions.
In this post, let’s look at what is VWAP trading. How can we apply VWAP into our trading?
What is VWAP
As I stated at the beginning of the post, VWAP stands for Volume Weighted Average Price. It is different from VWMA, I have written a blog post on VWAP vs VWMA to show the difference. Feel free to check it out.
The calculation of VWAP resets every session. It takes the current session’s price and volume information into consideration.
VWAP outputs the average price of the security so far during the session. It is a cumulative indicator that does not drop data as a moving average does.
Just to refresh your knowledge:
Moving average is an average of data over a fixed period. As time progresses, old data points are dropped out while the latest data is included in the calculation.
A simple moving average formula looks like this:
SMA = (P1 + P2 +….Pn) / n
Where:
P= Datapoint, e.g security price
n= number of time periods
In the following section, I will show you the calculation of VWAP, you will see the indicator does not drop out data over time.
How to calculate VWAP?
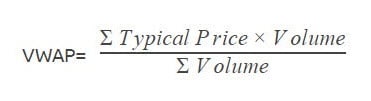
There are 2 main components of VWAP: Typical Price and Volume.
A typical price is the average of the High, Low, and Close.
Typical Price = (H+L+C)/3
Here is the formula of VWAP
Explanation:
The easiest way to explain the VWAP calculation is by using a spreadsheet. (I have shared the spreadsheet here).
To calculate VWAP, we take the sum of (Typical price x Volume) and divide it with the total volume of the current session.
Below is the 5-min data for 06 August 2020 extracted from TradingView.com. Most Forex brokers offer tick volume now.
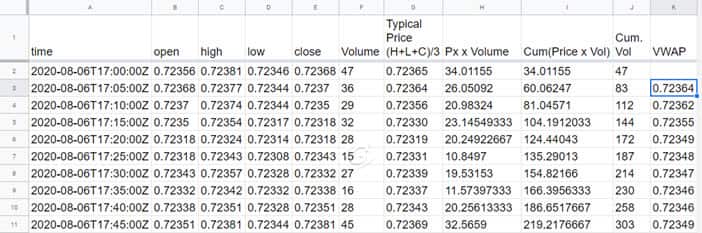
The purpose is to show you the calculation of the VWAP.
Step 1: Calculate the Typical Price.
The first step is to calculate the average of High, Low, and Close prices for the given period. The average is called the typical price.
At 17:00 the High is 0.72381, Low is 0.72346, and Close is 0.72368. The volume for the period is 47.
The typical price for the period is
Typical Price = (0.72381 + 0.72346 + 0.72368)/3 = 0.72365
For 17:05, the typical price is (0.72377+ 0.72344 + 0.7237)/3 = 0.72364
Step 2: Multiply the typical price with volume.
For 17:00 Typical Price x Volume = 0.72365 x 47 = 34.01155
For 17:05 Typical Price x Volume = 0.72364 x 36 = 26.05092
We need the cumulative sum of (Typical Price x Volume).
For 17:05 the cumulative of (Typical Price x Volume) =
[Typical Price (17:00) x Volume (17:00)] + [Typical Price (17:05) x Volume (17:05)]
34.01155 + 26.05092 = 60.06247
Step 3: Calculate the cumulative Volume
At 17:05 the cumulative volume will be volume (17:05) + volume (17:00)
=36+47 = 83
Step 4: Calculate the VWAP
Finally, to calculate VWAP,
VWAP = Cumulative (Typical Price x Volume) / Cumulative Vol
At 17:05, VWAP = 60.06248/83 = 0.72364
That’s it. We have the VWAP calculated.
VWAP is a cumulative indicator, as the day progresses, it continues to take in new price and volume information into consideration without dropping out old data points.
The calculation of VWAP stops at the end of the session or trading day.
How do institutional traders use VWAP?
Institutional traders use VWAP as a benchmark for their trade executions.
Institutional traders buy or sell a large number of contracts or shares. They want to reduce the impact as much as possible. They do not want to attract attention, causing a spike in volume, and affect the price.
To avoid that, they develop automated trading strategies that trade small chunks of shares or contracts. They make sure their closing prices are as close as possible to the VWAP.
To bring the market price back to the average, they buy below VWAP and sell above it.
What is VWAP trading? The applications of VWAP
In this section, I want to focus on how retail traders use VWAP in their trading.
There are 2 main applications of VWAP adopted by traders: Trend confirmation and Mean Reversion trading.
Use VWAP in Trend trading for trend confirmation
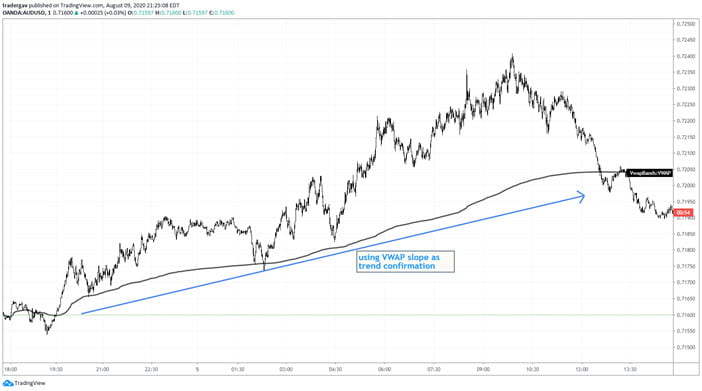
As VWAP is calculated by using the cumulative sum of price and volume during the session, it could be used as a trend confirmation tool.
The slope of VWAP is often used to determine the trend of the day.
A rising VWAP could indicate a bullish trend while a decreasing VWAP indicates a bearish market trend.
Mean Reversion Trading Strategy
Mean Reversion is one of the most popular day trading strategies. VWAP is a great tool to implement this strategy.
How does Mean Reversion work?
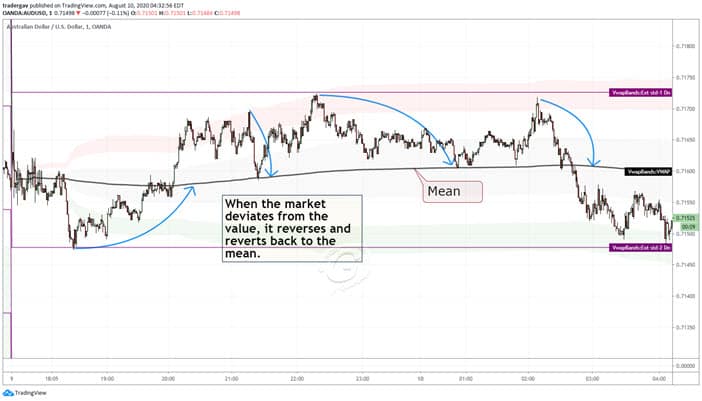
Mean Reversion strategy works on the assumption that there is a mean or fair price level. The market tends to fluctuate around this mean.
So when the market deviates far from the mean, it will tend to reverse and revert to the mean price level.
There are many ways to determine if the market is overvalued. Some traders use indicators like RSI or Bollinger bands. Each has its merit.
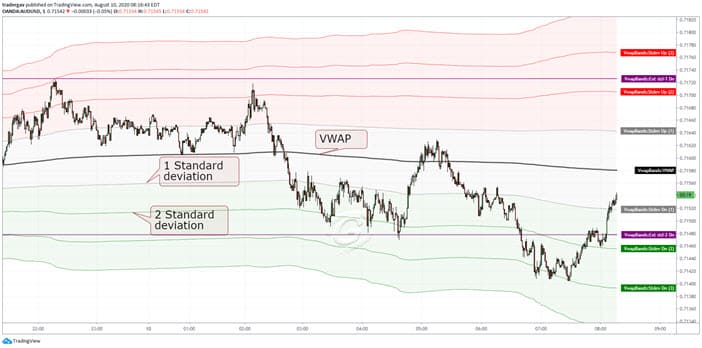
With VWAP, I like to use the standard deviations of VWAP to guide me. This is not a holy grail, but a guide to show me how far the market has moved away from its mean.
Free VWAP Indicator for TradingView
If you are using TradingView, I have shared a free script that will plot the VWAP line, standard deviation bands, and extensions. Feel free to add it to your account.
If you haven’t heard of TradingView, it is my favorite charting platform for Forex trading now. It is stable, and customizable. TradingView offers free and paid plans. Check it out here.
Try Tradingview Pro Charting Platform For 30 days
Tradingview is my go-to FX charting and trading solution. I have done extensive coding and trading on the platform. I am happy to recommend them.
If you are interested in using Tradingview, you can try out the Pro membership FREE for 30 days. This is an excellent time to check out the powerful features of Tradingview charting.
The Mean Reversion strategy works well in the choppy market. And it best suits short term traders.
What is VWAP trading – Final Thoughts
VWAP is an excellent day trading tool, it is a good barometer that shows the value of the current trading session.
Just like all trading indicators, it is not a holy grail.
Before you jump in and start trading with VWAP, make sure you have done the due diligence. Testing, verifying, and understanding how the indicator could help your trading.
How do you use VWAP in your trading?
Do you have any questions?
Feel free to leave me a comment below. I am happy to help.


Leave a Reply