• Skip to primary navigation
  • Skip to main content
  • Skip to primary sidebar
  • Skip to footer

TraderGav.com

Gav's trading blog - Perseverance, Consistency, Confidence

  • Home
  • Start Here
    • Back to Basics of Trading
    • Resource For Traders – The Best Tools for Traders
    • Learn Trading Articles
    • Sierra Chart Resource
  • Blog
    • Blog Posts
    • Other learning resource
    • Dummy Collection
    • Harmonic setups
  • About Me

Weekly Review of GOLD (XAUUSD) 08 AUG 2013

by Gav Leave a Comment

Here is the weekly review of spot GOLD XAUUSD levels. You can last week’s chart review in this post.

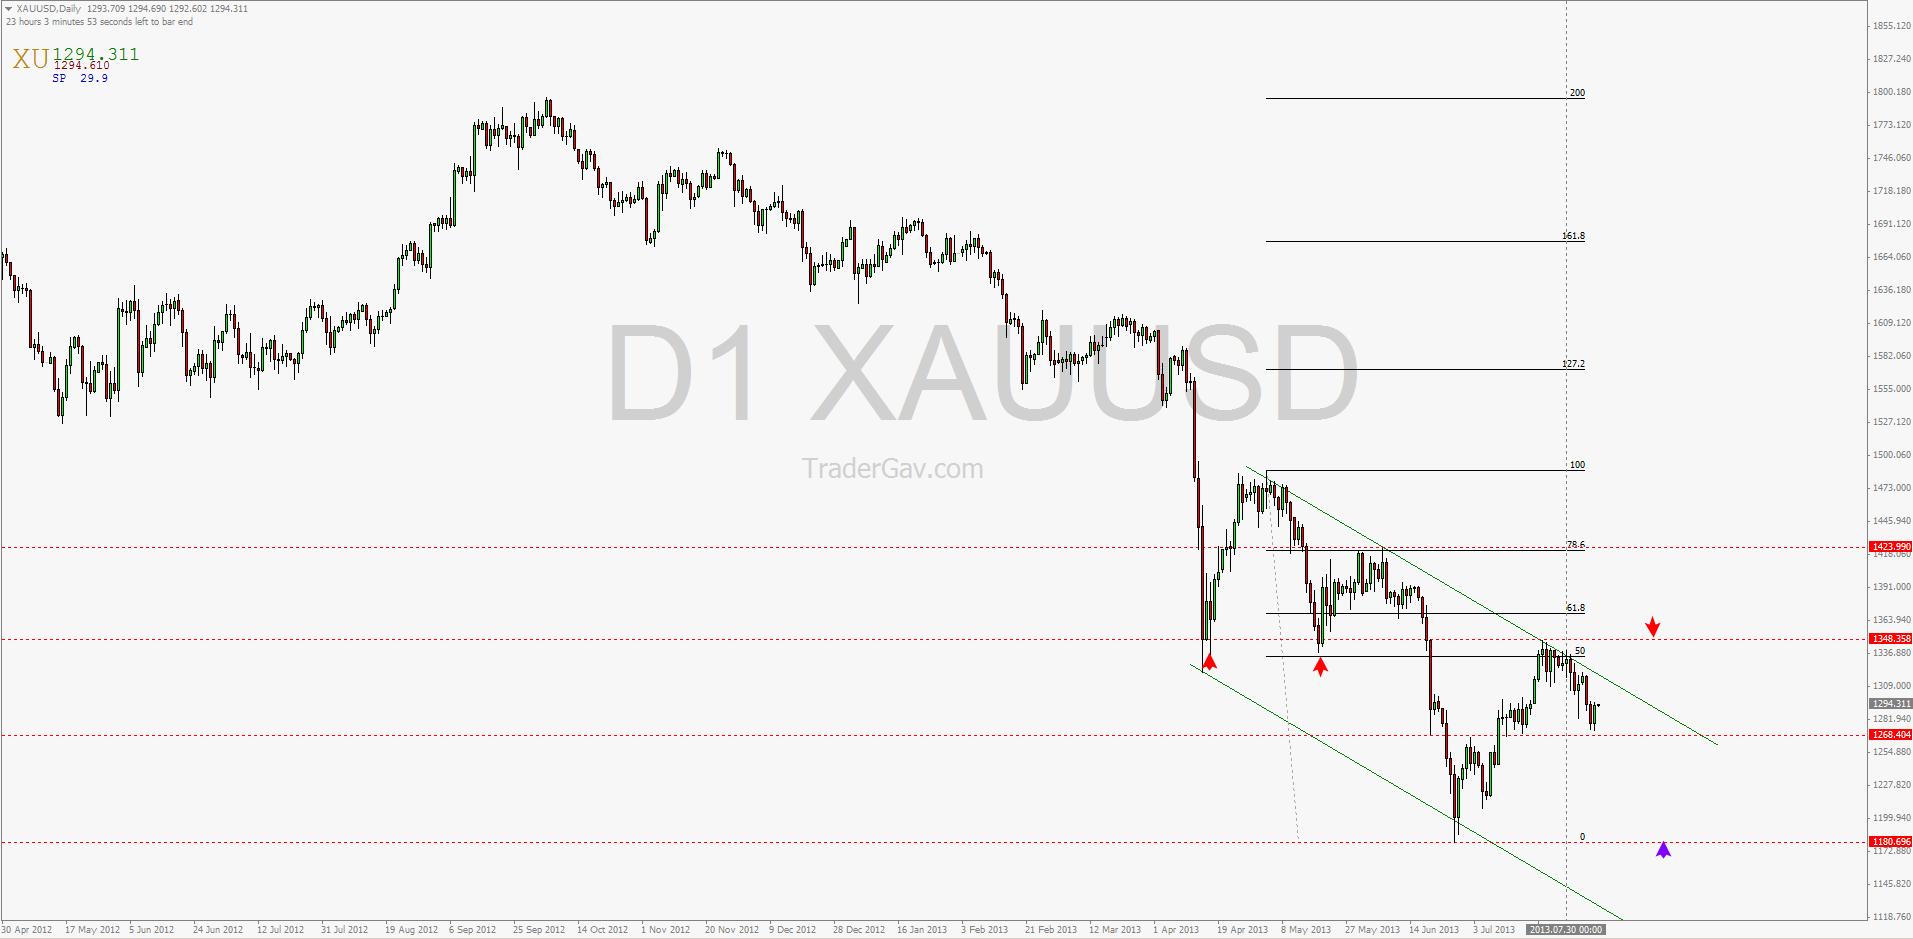
GOLD reacted at the resistance level and also 50% retracement of D1 down leg. 1347.57 is now the level to watch for any false break should price retrace back to this high. Overall, GOLD is contained in the Daily down channel. The key levels to watch now are 1297.55 for resistance and 1268.40/1272.22 for support.

Here is the Daily Chart of spot GOLD

GOLD Daily Chart
GOLD Daily Chart

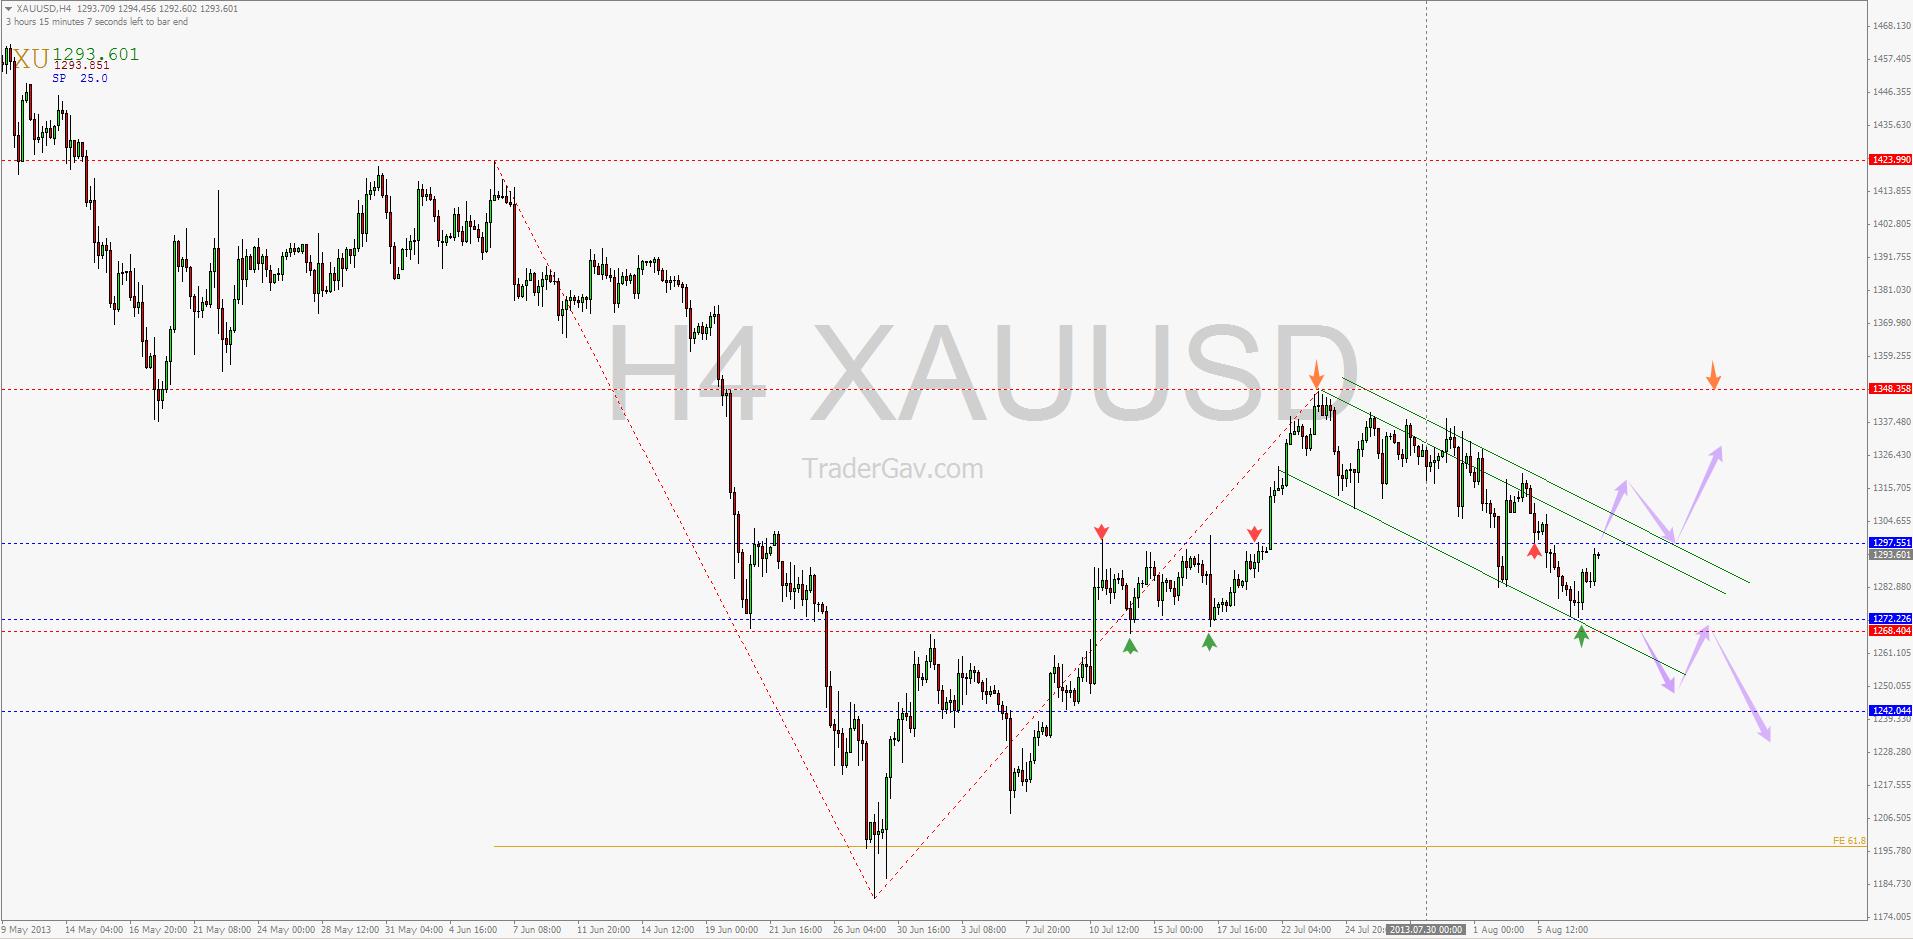
In 4-Hour time frame,  I am watching closely is the potential break up of the H4 down channel. Refer to the 4-hour chart below, a break of this channel, and 1297.55 might bring us back to 1347.57 as mentioned before. On the hand, a break of support level 1268.40/1272.22, I will be looking at potential short setup at the pull back.

GOLD 4-Hour Chart
GOLD 4-Hour Chart

That’s all for this post.

From the desk of TraderGav.com

Filed Under: headline post, Support Resistance, Trading Journal

Reader Interactions

Leave a Reply Cancel reply

Your email address will not be published. Required fields are marked *

Primary Sidebar

Best Tools For Traders

My Name is Gav.
I am a Father, Husband, Trader, And Blogger. A serious coffee addict. I started training since 2005, mainly on FX and Futures.

About Me

Footer

Recommend FX Charting

Recommended Training

FXSAnalytics

Copyright © 2023 · Affiliate Disclosure · Privacy