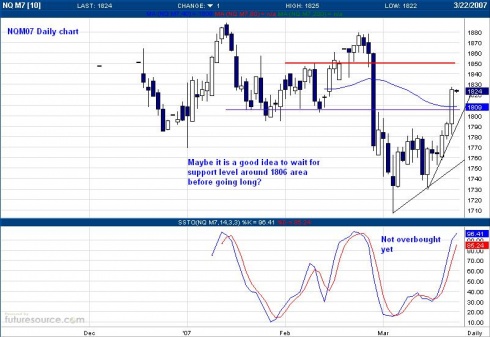
NQ daily chart end 21-Mar-2007
After watching couple of videos of 'Short term trading with Oscar' and heard some good words from Phileo, I start to do my daytrade preparation from daily chart. This is just to identify support/resistance levels and have a view of potential market direction of the day.
Here is daily chart of NQ June contract. We had 3 consecutives up days. With the result of Fed meeting yesterday, bulls are having an upper hand. I am interested to see any weakness to support areas to get long.
OMNI support area is at 1806-1804 as well.


Comments
Historical comments are preserved here. New comments are closed.