It is not a nice picture for STI. It , in fact, failed to stay above 50-day moving average and closed below 200-day moving average. And it formed a lower high. It is a bit difficult for me to stay bullish. I would prefer to stay at Short side. In addition, looking at stochastics, it is yet to enter oversold zone.

UOB sesdaq is on the line. It stays around on 50-day moving averages. It is likely for Sesdaq to ding-dong between 50-day and 200-day moving averages. Not so good for small cap, but I am not over bearish. I guess, a little bit patience is needed.
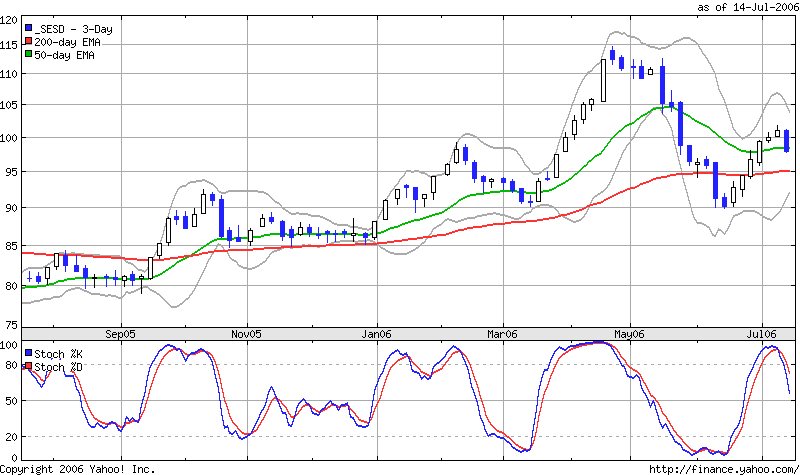


UOB Sesdaq – Potential shs? Which will be confirmed once 90 support is broken down.
UOB Sesdaq – Potential shs? Which will be confirmed once 90 support is broken down.