ATR (Average True Range) is one of the essential tools in my trading toolbox. It is not a holy grail, but it helps me to navigate the trading day and make trading decisions.
In this blog post, I want to go through details of the indicator and how I use them in my trading. Hopefully, it will help you to integrate into your trading system.
What is Average True Range (ATR)
The Average True Range is a technical indicator that was first introduced by J.Welles Wilder.
The indicator does not indicate or predict market direction. Instead, ATR measures the degree of volatility.
Originally, it was introduced for the commodities market. It is now widely used in stocks, futures, and Forex markets.
To understand how the indicator could help you in the trading, let’s look into the logic of it.
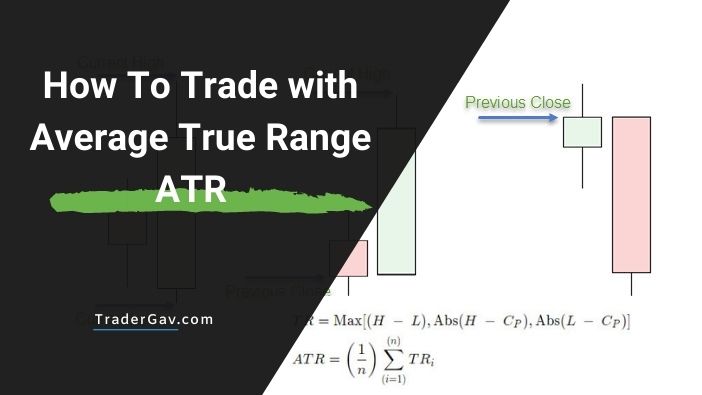
How to calculate ATR
To understand the calculation of ATR, you must first understand the definition of True Range. After all, ATR is just the average of a series of True Ranges.
By definition, the true range is the greatest of the following:
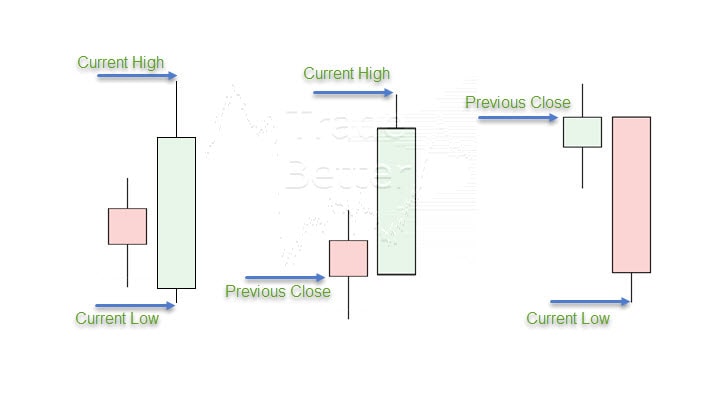
- High for the period less the Low for the period
- High for the period less the Close for the previous period
- Close for the previous period and the Low for the current period
Take note that, we are comparing the absolute values of the above 3 calculations.
For a 14-period Average True Range,
Current ATR= [(Prior ATR x 13) + Current TR] / 14
- Multiply previous 14-period ATR by 13
- Add the current True Range value
- Divide the total by 14
How does ATR work
# High ATR value
An expanding ATR indicates that there is an increase of volatility in the market. The range of the price bars are getting wider.
A reversal bar with increased ATR indicates the aggressiveness of the move. ATR is not directional. And expansion of ATR value might indicate selling or buying pressure.
A sharp move with a spike of ATR value is usually unsustainable.
#Low ATR value
A low ATR value indicates the narrow range of price bars. Market is moving sideways for a period of time.
An extended period of low ATR indicates consolidation.
Why use ATR
ATR reflects the volatility of the instrument.
Higher ATR figures represent higher volatility and the instrument with lower volatility has a lower ATR.
With the understanding of the volatility, it helps the trader to better manage an entry, stop loss, and profit-taking decisions.
Let’s put it this way.
In a volatile market condition, a tight stop is likely to be triggered before the position even has a chance to develop.
While during the lower volatility period, a wide stop would be a waste. It does not optimize the overall profitability of the trading strategy.
On the other hand, ATR also helps traders to better understand the profit potential of a system. In a less volatile market, a closer take-profit might be more efficient.
Try Tradingview Pro Charting Platform For 30 days
Tradingview is my go-to FX charting and trading solution. I have done extensive coding and trading on the platform. I am happy to recommend them.
If you are interested in using Tradingview, you can try out the Pro membership FREE for 30 days. This is an excellent time to check out the powerful features of Tradingview charting.
How to use ATR in Trading
There are two important notes you need to understand before start using ATR:
#1 It is a measurement of volatility
The most important thing you need to know is ATR does not measure or predict trend direction. Do not let others tell you otherwise.
It measures volatility.
#2 ATR is not a standalone indicator
Just like other indicators, ATR is not perfect. It should not be used as a standalone indicator that decides your entry, stop, and take-profit.
It should be used as a complement to your trading strategy. And most of the time, it is a great complement to a trading system.
Trailing Stop Placement
Trailing stop is a mechanism for you to exit a trade to either protect your profit or limit your loss.
If trailing stop is part of your trading system, ATR could be a great supplement for you.
As ATR measures the volatility of the market, it could be used to adjust the trailing stop.
Here is how you could use ATR for trailing stop:
- When you are in a trade, check the current ATR reading
- Multiply the ATR reading by 2
- For Long position, stop loss = Entry- 2xATR
- For short position, stop loss= Entry + 2xATR
It is a common suggestion to use 2xATR. It is not a magic number. It might not work for your market. But you get the idea here.
Give your position a breathing space by including current volatility into your stop loss order.
Daily Range Projection
Another idea to use ATR is to project the trading day’s extremes.
The idea is to use daily ATR values to project current day’s high and lows.
Here is the calculation
- Calculate 20-day ATR up to yesterday’s close
- Use current day’s High – 20-day ATR. This is the projected Low.
- Use current day’s Low + 20-day ATR. This is the projected High.
- These levels will change when the market makes a new high or new low.
The projected High and Low are the assumed extremes of the day. They could be treated as the day’s target or a trade location for counter trend trades.
How to trade with ATR – Closing words
Average True Range could be a useful tool for both swing trading and day trading alike. It offers traders another perspective on the market.
It tells you the volatility of the market. It helps to adjust trader’s expectations.
Again, average True Range is not a holy grail. Traders could benefit from it by integrating the indicator into a well-defined trading strategy.
Do you use ATR in your trading?
Do you have any questions or comments?
Leave me a line in the comment section. I am happy to help.
This post is part of my Back To the Basics of Trading series.


Leave a Reply